Low Power Server CPUs: the energy saving choice?
by Johan De Gelas on July 15, 2010 4:54 AM EST- Posted in
- IT Computing
Energy measurements
So we measured the power over a period of 70 minutes (longer than the slowest test run), and calculated the real energy (power x time) consumed.

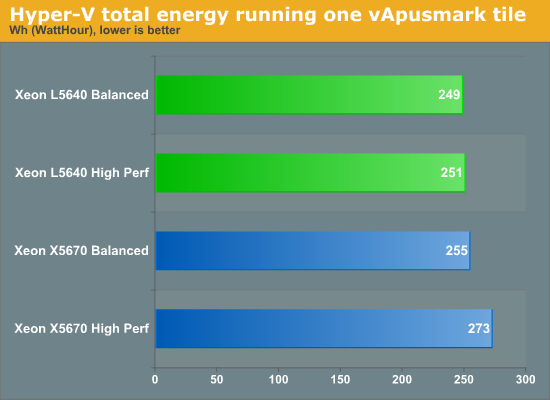
You can see that with the exception of the Xeon X5670 running with the high performance plan, there is almost no difference between the L5640 measurements and the “balanced” X5670. And let us look at performance now. We made a geometric mean of the number of URL/s and the number of database transactions that the server was able to process.
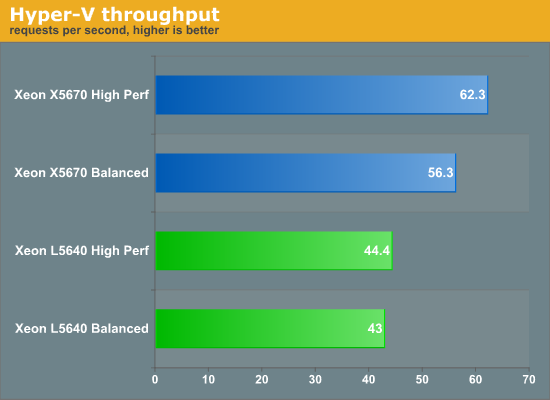
This graph explains why the Xeon X5670 does so well: as it is able to handle more transactions and web requests per second, it can empty the queues more quickly. When the web request and database queues are empty, the CPU can throttle back and save power. Since the idle power of the Xeon X5670 is pretty low (almost as good as the idle power of the low power version), this is a real tangible advantage.
Response time
At the end of day, users will not complain about throughput, they experience high response times as disturbing. Responses times are the ones that are part of the SLAs. Let us see what we measured. We made a geometric mean of the response time of the database queries and web requests.
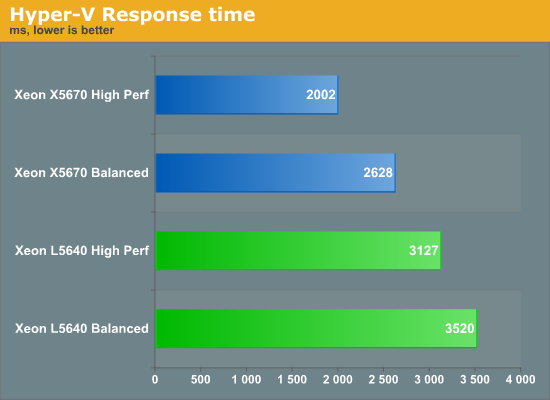
The results are stunning! Despite the fact that we do not max out the CPUs at all, the X5670 leaves the low power version far behind when it comes to response times. This is partly due to the fact that vApus Mark I is constructed as a CPU test. In your own datacenter you might not see the same results if you are (partly) I/O constrained of course. But if web and database applications are well cached, the higher performing CPU can deliver tangible lower response times.


49 Comments
View All Comments
WillR - Thursday, July 15, 2010 - link
10p per kWh may be low in the UK but it's not for residential in the US. $.12/kWh is average. Just pulled out a bill from earlier this year and we paid 7.3 cents per kWh at my house. What it comes down to is the data center potentially overcharges people in the, using your numbers, 19 to 38 cents per kWh range, but rates can be higher than $.20/kWh in high density areas like NYC or SF. The extra costs should go to paying for upgrades and expansion of their infrastructure so it's not unreasonable.Worth mentioning to put in perspective is 4 250 watt servers uses 720kWh/month and the average house in the US uses 920kWh/month, so it's not really as simple a setup as one might initially think.
http://www.eia.doe.gov/cneaf/electricity/esr/table... provides a nice table of average rates and usages.
knedle - Thursday, July 15, 2010 - link
I'm not sure if you're aware, but in most countries residential has much (at least twice) lower price per 1kWh, than commercial. Also commercial pays extra for using electricity during the day, and gets electricity cheaper during night.This is why there are some factories in Europe that work only during night.
WillR - Thursday, July 15, 2010 - link
That is not the case in the US. Residential pays higher rates than either Commercial or Industrial users.http://www.eia.doe.gov/cneaf/electricity/epm/table...
Average Retail Price (Cents/kWh)
Items Mar-10 Mar-09
Residential 11.2 11.33
Commercial 10.03 10.07
Industrial 6.5 6.79
Industrial settings tend to use very large amounts of energy in a very small area or number of clients so they get cheaper bulk rates for purchasing a lot with little administrative overhead. It's also often the case they can get a high voltage line installed directly to the plant which is expensive to install but increases efficiency dramatically.
These averages may reflect heavy use of off-peak consumption, but most plants I've experienced operate 24/7. Much of it is politics and bargaining for a better rate on the contract.
DaveSylvia - Thursday, July 15, 2010 - link
Hey Johan, great article as usual! Always enjoyed and appreciated your articles including those from back in the day at Ace's Hardware!JohanAnandtech - Thursday, July 15, 2010 - link
Good memory :-). I have been part of Anand's team for 6 years now, that is the same amount of time that I spend at Ace's.DaveSylvia - Thursday, July 15, 2010 - link
Yeah! One of the first tech articles I recall reading was back in 1999. It was about how pipeline length influenced CPU clock speeds. You used Pentium II, K6, DEC Alpha's as examples :). All good stuff!MrSpadge - Thursday, July 15, 2010 - link
Isn't there a power plan which lets the CPUs turbo up (as max performance does) and also lets them clock down if not needed (as balanced does)? It seems outright stupid to take turbo away from a Nehalem-like chip.
MrS
has407 - Thursday, July 15, 2010 - link
No reason you shouldn't be able to specify a power plan that does both, but for whatever reason it isn't provided out-of-the-box.I'd guess that given the relatively small difference in idle power between "performance" and "balanced" (which seems to be more of "power capped" plan), maybe they (presumably the OEM?) decided it wasn't worth it.
There may also be stability issues with some system configurations or support concerns, as there's yet another set of variables to deal with.
has407 - Thursday, July 15, 2010 - link
Johan -- That brings up an interesting question: How much of the underlying CPU's power management are you testing vs. a particular vendor or OS configuration? I'd expect them to closely reflect each other assuming everyone has their job.As you're using Win 2008, it would be interesting to see what powercfg.exe shows for the various parameters for different modes and systems; e.g., "Busy Adjust Threshold", "Increase Policy", "Time Check", "Increase Percent", "Domain Accounting Policy" etc. Are there significant differences across systems/CPUs for the same profile?
Whizzard9992 - Thursday, July 15, 2010 - link
Heat dissipation is also a concern, no? It's expensive to cool a datacenter. Low power should bring cooling costs down.There's also a question of density. You can fit more low-power cores into 1U of space because of the heat dissipation. Multi-node blades are cheaper than 2U workhorses. Rack space is expensive for a lot of reasons. Just look at the Atom HPC servers: I bet the Atom would score pretty low in performance-per-watt versus even the LP XEON, but its sheer size and thermal envelope fit it in places the XEON can't.
Frankly, I'd be surprised if the low-power XEON saved "energy" at the same workloads versus full-power, given that both are on the same architecture. LP XEONs are really an architecture choice, and greasing the transition to many-cores via horizontal scaling. A good desktop analogy would be, "Is one super-fast core better than a slower multi-core?" Fortunately for the datacenter most servers only need one or the other.
Also, with physical nodes scaling out horizontally, entire nodes can be powered down during down times, with significant power savings. This is software-bound, and I haven't seen this in action yet, but it's a direction nonetheless.
Without getting into all of the details, I think a proper TCO analysis is in order. This article seems to really only touch on the actual power-consumption, where there are really no surprises. The full-power peaks performance a little better, and the LP stays within a tighter thermal-envelope.
The value of low-power is really low-heat in the datacenter. I'd like to see something that covers node density and cooling costs as well. A datacenter with all LP-servers is unrealistic, seeing as how some applications that scale vertically will dictate higher-performing processors. It would be nice to see what the total cost would be for, say a 2,000 node data center with 80% LP population versus 20% LP population. The TDP suggests a 1/3 drop in cooling costs and 1/3 better density.