Western Digital's New VelociRaptor VR200M: 10K RPM at 450GB and 600GB
by Anand Lal Shimpi on April 6, 2010 8:00 AM EST- Posted in
- Storage
Truth be told I haven't had a mechanical hard drive on my test bench since shortly after the X25-M review back in 2008. Once the major hiccups that faced SSDs were dealt with, I switched all of my testbeds over. I got more consistent benchmarks, better performance and since I was using the X25-Ms, better reliability.
A week ago Western Digital wrote me and asked if I had any interest in covering hard drives. I'd been planning on building out a HDD addition to our live benchmark comparison engine, so I was definitely interested. It's not that I had forgotten about mechanical storage, it's that nothing exciting had happened there in a while.
It was 2003 when WD introduced its first 10,000 RPM desktop ATA hard drive - the Raptor. After 5 years of incremental updates, we saw the first major change in 2008 with the VelociRaptor. Western Digital moved to a 2.5" form factor mounted to a 3.5" heatsink. The smaller platters meant read/write heads had less distance to travel, which reduced access times. It also meant lower power consumption, something that would matter in the enterprise world. Before I made the switch to SSDs, the VelociRaptor was our testbed hard drive of choice. It was the fastest thing money could buy. But that was 2008. Since then even regular 7200RPM drives have been able to catch up to WD's dinosaur.
Despite releasing its first mainstream SSD, Western Digital is still committed to hard drive manufacturing. The cost per GB of even the cheapest SSDs are still far higher than the fastest hard drives, and thus there's room for newer, faster hard drives. The past couple of years have seen capacities go way up. Western Digital and Seagate both ship 2TB drives, and both of these drives are arguably just as fast as the original VelociRaptor still stuck at its 300GB capacity. That all changes today. This is the new VelociRaptor VR200M:
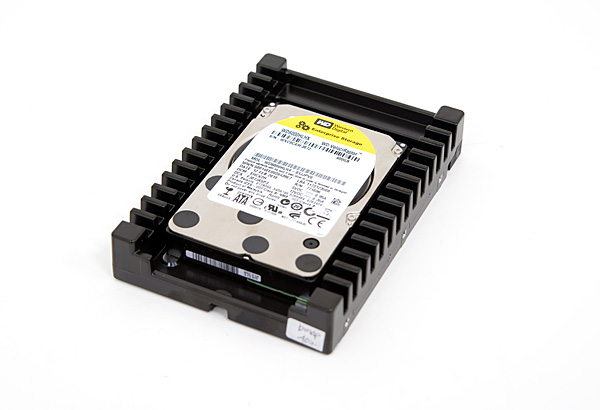
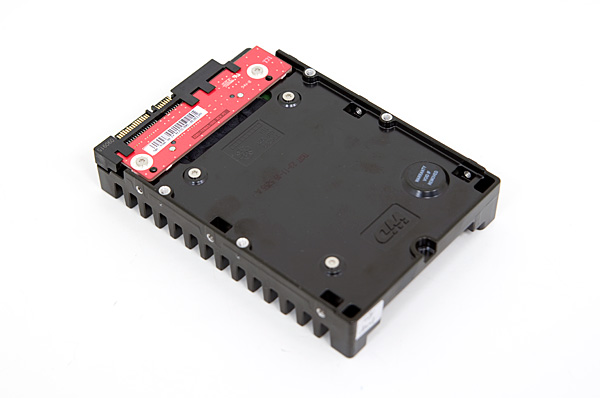
Available in 450GB and 600GB capacties ($299 and $329), the new VelociRaptor picks up where the old one left off. It's still a 2.5" drive with an optional 3.5" heatsink (called the IcePAK, standard on all drives sold in the channel) that'll keep it cool and let it mount easily in a 3.5" bay. The 2.5" drive measures 15mm in height, so you can't use it in most notebooks in case you were wondering.
WD increased platter density from 150GB to 200GB, which results in higher sequential transfer rates and lower track to track seek times (0.75ms down to 0.4 ms). Average seek time remains unchanged at 3.6ms thanks to the drive's 10,000 RPM spindle speed. The buffer moves up to 32MB from 16MB. Just like the old VelociRaptor, WD has chosen not to outfit this new drive with its largest buffer (64MB currently shipping on the Caviar Black drives).
| Specifications | ||||
|
WD VelociRaptor VR200M |
WD VelociRaptor VR150M |
|||
| Capacity | 600GB/450GB | 300GB/150GB | ||
| Interface | SATA 6 Gb/s | SATA 3 Gb/s | ||
| Rotational Speed | 10,000 RPM | 10,000 RPM | ||
| Buffer Size | 32MB | 16 MB | ||
| Track to Track Seek | 0.4 ms | 0.75 ms | ||
| Average Seek Time | 3.6 ms | 3.6 ms | ||
| Full Stroke Seek | 8.5 ms (typical) | 8.5 ms (typical) | ||
|
Transfer Rate Buffer to Disk |
145 MB/s | 128 MB/s | ||
| Platter Density | 200GB per platter | 150GB per platter | ||
| Warranty | 5 - Years | 5 - Years | ||
| . | ||||
The on-board controller is WD's latest dual-core design. I don't have much information about it but I'm guessing that because drive management is getting more complex, the controllers must scale up in complexity as well. The drive supports 6Gbps SATA, however you see no performance benefit from it (in fact, in many cases it's actually slower than 3Gbps SATA if you've got a good integrated SATA controller).
Western Digital claims to have increased the number of head load/unload cycles the new VelociRaptor can withstand. The drive heads must be positioned over the rotating platters in order to read/write data. When they aren't in use, the heads are retracted (or unloaded) to prevent any accidental damage to the platters and thus your data. The old 300GB VelociRaptor was rated for 50,000 load/unload operations. The new VR200M? 600,000.


77 Comments
View All Comments
vol7ron - Tuesday, April 6, 2010 - link
Agreed, it could be done, but it would also cause more confusion when you could see data in one place, but not in another. Not to mention, it's probably easier not to have to worry about it from an editor's standpoint - a bad excuse, but probably true.vol7ron
Muon - Tuesday, April 6, 2010 - link
Skewing the graphs is a ludicrous argument not to include SSD in the test. Why not use a logarithmic scale? I guess maybe people in the USA are too dumb to understand such graphs and would think the performance difference is much smaller then it really is.Earthmonger - Tuesday, April 6, 2010 - link
What would be the point of including SSD results?Would you compare a horse and buggy to a turbo-diesel 18-wheeler?
A wax candle to a halogen headlamp?
HotFoot - Tuesday, April 6, 2010 - link
People aren't really selling oxen and wagons to compete with 18-wheelers, whereas the Raptor here is a new product brought into the high-performance storage for desktops market. It certainly is competing against SSDs or a combination of SSD+HDD.I think the general consensus is if you're wanting a lot of performance in a desktop, you'd do better to take the $330 and buy an 80 GB SSD and a 1 TB HDD. I think, given it's about the same price for nearly double the storage capacity, it's be a VERY interesting combination to see on the performance charts.
This entire article basically starts out with the understanding that the new Raptors were obsolete before they ever launched to market.
+
Anand Lal Shimpi - Tuesday, April 6, 2010 - link
The assumption here is someone who wants a VelociRaptor for whatever reason has already ruled out an SSD. If I threw in SSD results it'd be very difficult to make comparisons between the VR and other hard drives as they'd get compressed in the chart.In the not too distant future we'll allow cross technology comparisons between HDDs and SSDs in Bench, but until then I figured just pointing folks at Bench if they wanted SSD results would suffice.
Take care,
Anand
jimhsu - Wednesday, April 7, 2010 - link
Not exactly. Even using this drive in lieu of a SSD for a boot drive is "stupid" (which I think it is), people with hundreds of gigabytes of Steam games or such simply aren't satisfied with the performance of a 1 TB drive. Putting 500 GB of games on SSD is ... expensive. Plus as I have shown in some forum posts, *most* modern games aren't so sensitive to random read/write rates anyways, so the benefit of a SSD is less than for general apps. (MMORPGs, particularly WoW in my testing, are a very clear exception)vol7ron - Tuesday, April 6, 2010 - link
@Muon:
"Skewing the graphs is a ludicrous argument not to include SSD in the test."
I'm guessing most figures from these tests are not done all at once. The charts are more likely a compilation of all the singular tests for that product, for that test bed. Meaning one test may have been run a month ago. Therefore, the SSDs are included in the tests, the results are just posted someplace else. -- go check the storage bench
"Why not use a logarithmic scale?"
Charts are included to have something visible and simple, not something you want to have think about to understand what it represents - that's the whole idea of chart vs table. Bar graphs are perfect because they are proportional and are able to list quanity, rather than a power or base of that quanity. Additionally, how would propose introducing a logarithmic chart - instituting a trendline? - if you take each value to the same base log, you're going to have the same problem with scale, and if you're using the trendline, your graph may be relational, but it will be also be visually innacurate for this type of data.
"I guess maybe people in the USA are too dumb to understand such graphs and would think the performance difference is much smaller then it really is."
That may be. Again, you'd be losing the quick-glance feature of the charts. Not to mention, AT probably has some simple charting software (or macros) that they use, which would need to be changed. If something is so much different, it's not worth including or modifying the portion of your chart. SSDs are in a league of their own and therefore have their own charts - HDDs are included in them because they won't skew the SSD chart AND the value doesn't need to be legible, all that needs to be seen is that the HDDs are insignificant. Because this particular value is about HDDs, the visual true-value comparison is necessary. You would not get that if an SSD was present.
vol7ron
vol7ron - Tuesday, April 6, 2010 - link
I'm just curious what the Windows index rating is. I know that doesn't really account for anything, but I like looking at that, for some awful reason.RaistlinZ - Tuesday, April 6, 2010 - link
I can buy two Samsung Spinpoint F3 1TB drives ($180.00) and put them in RAID 0 and get way more performance, and way more storage space, for 2/3 of the price of the 450GB Raptor. So what's the point of these Raptors exactly? I still don't see where they fit in.Fastidious - Tuesday, April 6, 2010 - link
Yeah, they seem pointless. I never understood why people buy them. With SSD around now it's just that much worse.