OWC Mercury Extreme SSD - First Look at a 50GB SandForce Drive
by Anand Lal Shimpi on February 26, 2010 12:00 AM EST- Posted in
- Storage
Update: Since the publication of this review OWC appears to have switched controllers for the Mercury Extreme SSD. The current specs look similar to that of SandForce's SF-1200 controller, not the SF-1500 used in the earlier drives. Performance and long term reliability (in an enterprise environment) are both impacted. For more information, read this.
I must admit, I owe OWC an apology. In my Vertex LE review I assumed that because my review sample had an older version of SandForce’s firmware on it that the company was a step behind OCZ in bringing SandForce drives to market. I was very wrong.
For those of you who aren’t Mac users, Other World Computing (OWC) just shouldn’t be on your radar. The only reason I’ve heard of them is because of my Mac experience. That’s all about to change as they are technically the first company to sell SandForce based SSDs. That’s right, OWC even beat OCZ to the punch. The first customers actually got drives the day my Vertex LE review went live. Multiple days before the LE actually went on sale at Newegg.
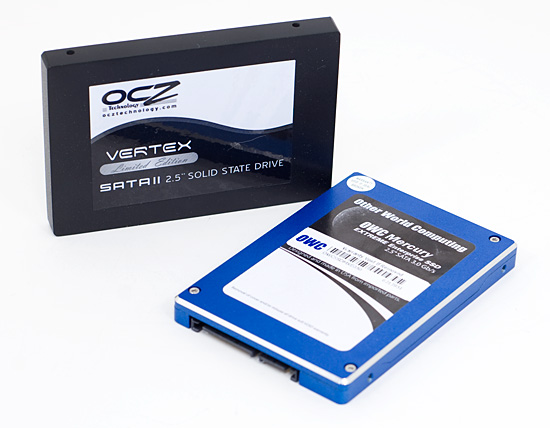
I mentioned it briefly in my Vertex LE review. The OWC Mercury Extreme SSD is based on the same SandForce controller as the Vertex LE. There was some confusion as to exactly what this controller is. As of today there is only a single SandForce MLC SSD controller shipping. It’s somewhere in between the performance of an SF-1200 and a SF-1500. Ultimately we’ll see the SF-1500 move to high end enterprise drives only, with the SF-1200 used in consumer drives like the OCZ Vertex 2 and Agility 2. The accompanying firmware is also somewhere in between the SF-1200 and SF-1500 in terms of performance (more on SandForce's controllers here). But as I just mentioned, its the equivalent of what OCZ is shipping in the Vertex LE.
OWC has assured me that all drives that are being sold have the latest RC1 firmware from SandForce, just like the Vertex LE. The firmware revision number alone should let you know that like the Vertex LE, these are wholly unproven drives. OWC is only sending out drives on 30 day evaluation periods, so I don’t expect many long term reliability tests to be done on those drives in particular. Thankfully we do still have the Vertex LEs to hammer on.
I previewed the Mercury Extreme in my last article, stating that it performs identically to the Vertex LE. Not only does it perform the same, but it's also a little cheaper:
| Capacity | OCZ | OWC |
| 50GB | N/A | $229.99 |
| 100GB | $429.00 | $399.99 |
| 200GB | $929.99 | $779.99 |
OWC is the first company to offer a 50GB drive based on the SandForce controller. I’d long heard rumors that performance was significantly lower on the 50GB drive, but I had no way of testing it. OCZ still doesn’t have any 50GB drives. OWC gave me the opportunity to answer that question.
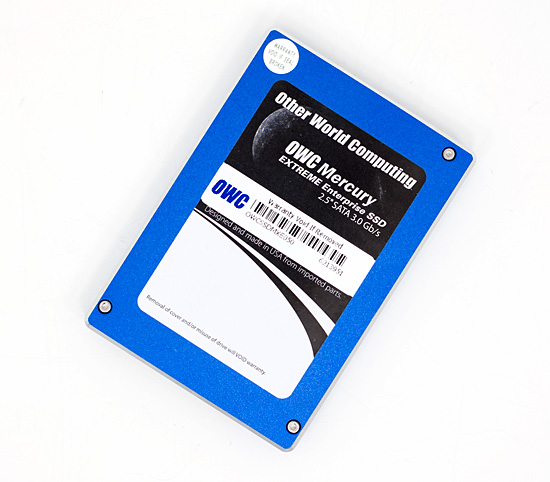
OWC got upset with me when I took their drive apart last time, so I can't provide you guys with internal shots of this drive. The concern was that opening the drive left it in an unsellable condition. I would hope that no company is reselling review samples, but you never know.
The 50GB Mercury Extreme carries a $229 price tag, that’s comparable to other small-capacity SSDs on the market:
| SSD | Price | Price per GB of NAND |
| Corsair P64 64GB | $209.00 | $3.266 |
| Intel X25-M G2 80GB | $219.99 | $2.750 |
| Kingston SSDNow V Series 64GB | $139.99 | $2.187 |
| OWC Mercury Extreme 50GB | $229.99 | $3.594 |
Unfortunately it does give you the worst cost per GB of NAND, and even worse when you consider how much of that is usable accessible. Remember that these SF-1500 controllers are derivatives of SandForce’s enterprise SSD efforts, meaning they are designed to use a lot of spare area.
Despite having 64GB of MLC NAND on board, the 50GB drive has a formatted capacity of 46.4GB. Nearly all of the extra flash is used for bad block allocation and spare area to keep performance high.
I installed Windows 7, drivers and PCMark Vantage on my 50GB drive which left me with 30.8GB of free space. That’s actually not too bad if you aren’t going to put a whole lot more on the drive. There’s more than enough room for a few applications, but think twice before using it for media storage.
Preview Today, More Tests Coming
It’s sheer excitement that made me push this review out today. I was really curious to see how well one of these 50GB SandForce drives performed. I have seen some of you request that you’d like to see more non-I/O specific, real world tests in our suite. I’ve done this in previous articles but stopped simply because the data didn’t seem to provide much value. These drives are so fast that measuring application launches, game level loads or boot time simply shows no difference between them all. Instead, by focusing on pure I/O performance I’ve at least been able to show what drives are technically the fastest and then base my recommendation on a good balance of raw performance and price. Then there’s the stuff that’s more difficult to benchmark - long term reliability and consistency of performance. Most of these drives end up in one of my work machines for several months on end. I use that experience in helping formulate my recommendations. In short, I’m still looking to expand the test suite and add meaningful tests - it’s just going to take some time. This is a lengthy process as each new controller poses new challenges from a benchmarking perspective.
The Test
| CPU | Intel Core i7 965 running at 3.2GHz (Turbo & EIST Disabled) |
| Motherboard: | Intel DX58SO (Intel X58) |
| Chipset: | Intel X58 + Marvell SATA 6Gbps PCIe |
| Chipset Drivers: | Intel 9.1.1.1015 + Intel IMSM 8.9 |
| Memory: | Qimonda DDR3-1333 4 x 1GB (7-7-7-20) |
| Video Card: | eVGA GeForce GTX 285 |
| Video Drivers: | NVIDIA ForceWare 190.38 64-bit |
| Desktop Resolution: | 1920 x 1200 |
| OS: | Windows 7 x64 |


74 Comments
View All Comments
Anand Lal Shimpi - Saturday, February 27, 2010 - link
I present the inverse of average latency - IOPS :) Take 1/IOPS and you'll get average latency per IO. I figure it's easier to convey performance this way (bigger numbers mean better performance).Take care,
Anand
ssdreviewer - Saturday, February 27, 2010 - link
as the following posts already pointed out, that's not the case. it would be better you could present directly minimum/average/maximum latency data, rather than IOPS, which has no linear relations with latency under different QD. my applications rely more on latency than random r/w or IOPS, i.e. responsiveness is more crucial here. that being said, i would like to see more direct results from AS SSD and HDTune Pro access time tests. thanks.jimhsu - Saturday, February 27, 2010 - link
That method can't give you information on maximum IO latency (which for me is the critical one, if you're concerned with gaming, real time video streaming, multimedia creation, etc). A drive with 0.1 ms latency but that peaks at 500 ms could be subjectively worse than one with 0.2 ms latency but that peaks at 100 ms.GullLars - Saturday, February 27, 2010 - link
Actually, you need to take Queue Depth (QD) into account. This noted the formula is QD/IOPS, since IOPS = 1/([average accesstime]*[QD]) (this formula is known as Littles Law). If you test at QD=1, 1/IOPS = average accesstime, it's a special case. Since your IOPS tests are at QD 3 and IOPS is represented as bandwidth (IOPS*block size), you find average accesstime (at QD 3) in ms by the formula 3/([bandwidth in MB/s]/4(KB)) (not factoring in MB/KB means s->ms) = 12/[bandwidth in MB/s].From my SSD project a month back, i found average accesstime increases as QD increases, and when QD=#channels average accesstime double when QD doubles. The reason for increased accesstime up to QD=#flash channels are (primarily) in two parts.
1. Statistical distribution says some channels will get multiple requests in queue while some go unused, therefore # of saturated channels < QD. The channels with queue will have single accesstime multiplied with queue lenght for average accesstime.
2. Controller NCQ overhead, the controller adds latency when administrating the queue.
Paladin1211 - Friday, February 26, 2010 - link
I just look at the AnandTech Storage Bench charts, the Kingston V+ performs so good, going neck and neck with Intel and Indilinx MLC in Heavy Workload. How could it be that fast, Anand?Paladin1211 - Friday, February 26, 2010 - link
Ops, I mean SLC, not MLC.Too good to be true...
Paladin1211 - Friday, February 26, 2010 - link
In random write/read test, the V+ scores are so poor. Something is not right here.Anand Lal Shimpi - Saturday, February 27, 2010 - link
The heavy workload is nearly half sequential. It's a heavy downloading and multitasking workload, which has thus far paved the way for a few unexpected strong performers. Remember that most controller makers actually optimize for sequential performance, which this benchmark tests more than any of the other tests. I still can't quite figure out why the Toshiba controller does so well here other than that it must really be tuned for this type of a workload. I've run and re-run the test, the results are always the same.Take care,
Anand
GullLars - Friday, February 26, 2010 - link
Just thought I'd add a link to a couple of graphs i made of IOPS scaling as a function of Queue Depth for 1-4 x25-V in RAID 0 from ICH10R compared to x25-M 80GB and 160GB, and 2 x25-M 80GB RAID 0. These are in the same price range, and the graphs will show why i think Anands reviews don't show the whole truth when there is no test beyond QD 8.link: http://www.diskusjon.no/index.php?app=core&mod...">http://www.diskusjon.no/index.php?app=c...h_rel_mo...
The tests were done by 3 users at a forum i frequent, the username is in front of the setup that was benched.
The IOmeter config run was: 1GB testfile, 30 sec run, 2 sec ramp. Block sizes 0,5KB, 4KB, 16KB, 64KB. Queue Depths 1-128, 2^n stepping. This is a small part of a project from a month back mapping SSD and SSD RAID scaling by block size and queue depth (block sizes 0,5KB-64KB 2^n stepping, QD 1-128 2^n stepping).
ATTO is also nice to show scaling of sequential performance by block size (and possibly queue depth).
cditty - Friday, February 26, 2010 - link
Another great article. I have to give it to you, Anand. Your SSD coverage is by far the best on the net. I have learned so much from your various articles.