The Intel Core Ultra 7 155H Review: Meteor Lake Marks A Fresh Start To Mobile CPUs
by Gavin Bonshor on April 11, 2024 8:30 AM ESTCore-to-Core Latency: Meteor Lake vs. Phoenix vs. Raptor Lake
As the core count of modern CPUs is growing, we are reaching a time when the time to access each core from a different core is no longer a constant. Even before the advent of heterogeneous SoC designs, processors built on large rings or meshes can have different latencies to access the nearest core compared to the furthest core. This rings true especially in multi-socket server environments.
But modern CPUs, even desktop and consumer CPUs, can have variable access latency to get to another core. For example, in the first generation Threadripper CPUs, we had four chips on the package, each with 8 threads, and each with a different core-to-core latency depending on if it was on-die or off-die. This gets more complex with products like Lakefield, which has two different communication buses depending on which core is talking to which.
If you are a regular reader of AnandTech’s CPU reviews, you will recognize our Core-to-Core latency test. It’s a great way to show exactly how groups of cores are laid out on the silicon. This is a custom in-house test, and we know there are competing tests out there, but we feel ours is the most accurate to how quick an access between two cores can happen.
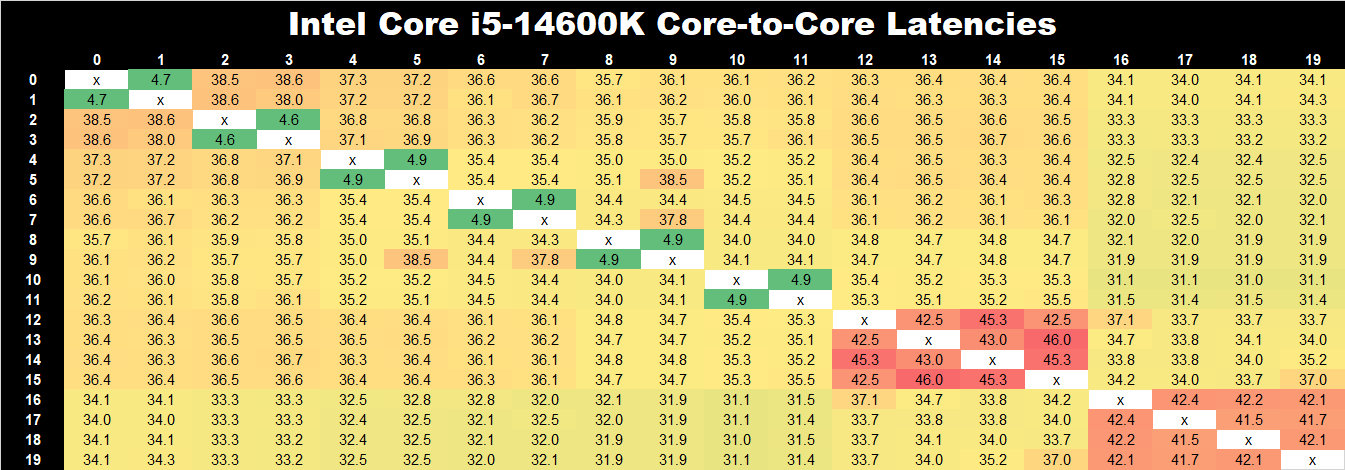
In this core-to-core latency analysis, we'll compare the Intel Core Ultra 7 155H, based on their latest Meteor Lake architecture, directly to a similar processor from Raptor Lake, the Core i5-14600K. Both have the same 6P+8E core configuration, with the Core Ultra 7 155H coming with two Low Power Island (LP) Efficiency cores embedded within the SoC.
These LP E cores are based on the same Crestmont microarchitecture as the larger Efficiency cores within the compute tile but are designed to operate with a lower voltage-to-frequency (V/F) curve, emphasizing that they are designed to operate at an overall lower power envelope. The key idea is that the LP E cores offload the lightest and least demanding background tasks with the aid of Intel's Thread Director – and ideally, avoid powering up the compute tile altogether for mundane background threads.

(Click to enlarge)
Looking at the core-to-core latencies of the Intel Core Ultra 7 155H, which showcases the physical topology of the processor itself, there are a couple of interesting points to note. Firstly, Intel's Meteor Lake compute tile with both the P-core and E-cores that are built on the Intel 4 node employ a similar bi-directional cache coherence as per its previous architectures, such as Alder Lake and Raptor Lake. From Intel's previous heterogeneous architectures, such as Alder Lake and Raptor Lake,
(Click to enlarge)
Starting with the Redwood Cove (P) core cluster on the Core Ultra 7 155H, we can see that the inter-core latency access latencies across the P-cores range from 4.5 to 4.9 ns, which is very similar to that of Raptor Lake via the Core i5-14600K, which sits between 4.6 and 4.9 ns; this indicates that both have a very similar topology. Interestingly, Intel has placed a single P-core at the front of the topology, which has an inter-core latency of 5 ns. Going outside to contact other cores, the latency increases within the P-Core cluster up to 39.9 ns, which is very similar to Raptor Lake.
For the E-cores, the latencies shoot up to between 57.9 and 74.8 ns per each L1 access point, with the two first E-cores having a latency of just 5.0 ns. For reference, the Core i5-14600K, which is based on Raptor Lake, has lower efficiency core-to-core latencies of between 41.5 and 46 ns. Outside of the initial L1 access, the latencies shoot up, as expected, to between 45.2 and 75.4 ns at the top end of the scale.
Lastly, the Low-Power Island E-cores are designated as Core 20 and 21. They have much higher latencies of up to 152 ns, which isn't very efficient when communicating with cores in other clusters. They also have the longest route to take to reach any other core clusters, since they need to go off-die over to the compute tile to talk to the rest of the CPU cores. However, even between themselves, the core-to-core latency is still high, at 116.8 ns. This strongly emphasizes how the LP cores are not meant to be treated as part of the larger pool of CPU cores for multi-threaded tasks, and instead are best left to handle background activities.
(Click to enlarge)
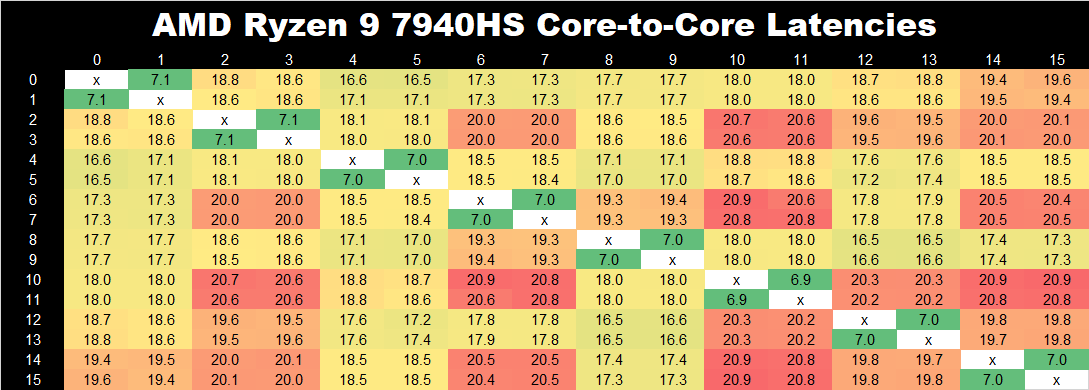
Throwing AMD's Ryzen 9 7940HS into the mix, the Phoenix architecture uses AMD's Zen 4 cores on an FP8 chipset and is built using TSMC's 4 nm node. With a monolithic core and cache coherency structure, the inter-core-to-core latencies on this chip are higher than Intel's P-Core cluster on both Meteor Lake and Raptor Lake, with a consistent L1 range of between 7.0 and 7.1 ns. Hopping between other cores within the cluster on the Ryzen 9 7940HS, latencies hit up to 20.8 ns, which is much lower overall than the heterogeneous architecture Intel is using with P and E-cores while adding the LP E cores into the mix to push these latencies higher.
Cache Latencies
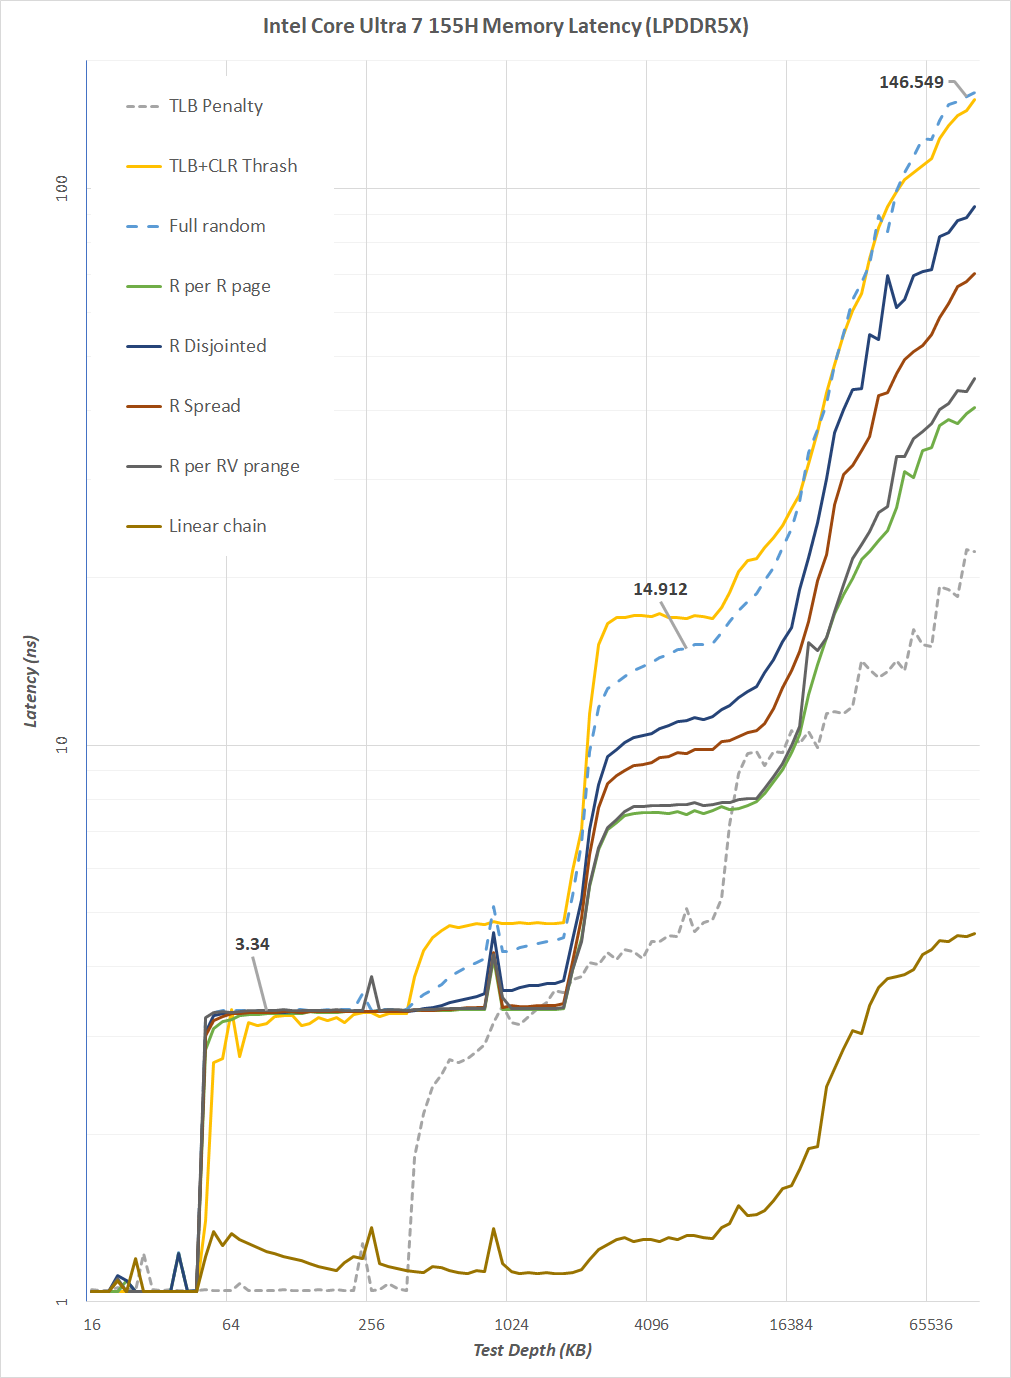
Examining the Core Ultra 7 155H's memory latency with LPDDR5X, the above graph looks at various test depths and shows the impact on latency through the different levels of cache. The baseline latency for linear memory access patterns remains consistently the lowest, with efficient[ prefetchers in using predictable patterns,
Across random access scenarios, the full random test exhibits higher latency across all depths, highlighting the increased time required for memory accesses when they are not sequential. This is a common challenge for CPUs when dealing with unpredictable data access, which is more typical than not within many real-world applications.
Latency inherently shoots skyward when we cross the L1 and L2 cache thresholds, as evident from the latency jumps at specific test depths. An example of this is at the 1024 KB test depth, where we can see an increase in latency for random access patterns. This means that the test depth exceeds the capability of the cache, as the Core Ultra 7 155H has to fetch data from the DRAM.
Focusing on Translation Lookaside Buffer (TLB) performance, our data indicates the Core Ultra 7 155H suffers a latency penalty whenever a TLB miss occurs (TLB Penalty line), which aligns with the expected behavior when data extends beyond the cache. The latency further skyrockets whenever TLB misses, and the TLB+CLR Thrash line points towards worst-case scenarios in memory access.
As the test depth extends to 16384 KB and beyond, nearly all memory access patterns converge towards higher latencies, indicating the reliance on main memory as the cache sizes are exceeded. This suggests that despite increasing latency with larger caches within Meteor Lake's memory hierarchy, the Core Ultra 7 155H still benefits from an overall larger cache capacity, which should result in higher performance with data stored within the cache instead of accessing data externally.
The Meteor Lake memory subsystem is nearly identical to that we've seen on Raptor Lake via the Core i5-14600K, which is also highlighted, and it seems designed to optimize for larger cache capacities while trying to negate any trade-offs in latencies. The Core Ultra 7 155H CPU does seem to navigate these trade-offs, managing various access patterns with varying efficiency, at least within the 1024 KB testing depth and below.
In contrast to AMD's Phoenix mobile architecture using Zen 4, which closely resembles the cache of Zen 3, albeit with more L2 and an uptick in cycles, we can see a spike in TLB+CLR Thrashing compared to Meteor Lake. Still, inherently, below the 1024 KB test depth, both memory substructures on Meteor Lake and Phoenix remain competitive. Beyond 1024 KB, we see higher latencies, which is a direct result of crossing the L1 and L2 TLB thresholds at 112 KB of L1 per P-core and 2 MB of L2 per P-core.


69 Comments
View All Comments
Gavin Bonshor - Friday, April 12, 2024 - link
I refer to it as a major gain; the other victories weren't huge. That was my point Replysjkpublic@gmail.com - Thursday, April 11, 2024 - link
Comparing the 155H to the 7940HS is apples to oranges. A better comparison would be the 185H. ReplyBigos - Thursday, April 11, 2024 - link
What happened to SPECint rate-N 502.gcc_r results? I do not believe desktop Raptor Lake is 16-40x faster than the mobile CPUs... ReplySarahKerrigan - Thursday, April 11, 2024 - link
No, something is clearly wrong there. I deal with SPEC a lot for work and that's an abnormally low result unless it was actually being run in rate-1 mode (ie, someone forgot to properly set the number of copies.) ReplyGavin Bonshor - Friday, April 12, 2024 - link
I am currently investigating this. Thank you for highlighting it. I have no idea how I missed this. I can only apologize Replymode_13h - Monday, April 15, 2024 - link
While we're talking about SPEC2017 scores, I'd like to add that I really miss the way your reviews used to feature the overall cumulative SPECfp and SPECint scores. It was useful in comparing overall performance, both of the systems included in your review and those from other reviews.To see what I mean, check out the bottom of this page: https://www.anandtech.com/show/17047/the-intel-12t... Reply
Ryan Smith - Monday, April 15, 2024 - link
That's helpful feedback. It's a bit late to add it to this article, but that's definitely something I'll keep in mind for the next one. Thanks! Replymode_13h - Wednesday, April 17, 2024 - link
You're quite welcome!BTW, I assume there's a "standard" way that SPEC computes those cumulative scores. Might want to look up how they do it, if the benchmark doesn't just compute them for you. If you come up with your own way of combining them, your cumulative scores probably won't be comparable to anyone else's. Reply
Ryan Smith - Wednesday, April 17, 2024 - link
"BTW, I assume there's a "standard" way that SPEC computes those cumulative scores."Yes, there is. We don't run all of the SPEC member tests for technical reasons, so there is some added complexity there. Reply
mczak - Thursday, April 11, 2024 - link
Obviously, the cluster topology description is wrong in the core to core latency measturements section, along with the hilarious conclusion the first two E-cores having only 5 ns latency to each other. (First two threads of course belong to a P-core, albeit I have no idea why the core enumeration is apparently 1P-8E-5P-2LPE.) Reply