Intel P965: The Double Mint Twins Gone Wild
by Gary Key on November 9, 2006 8:00 PM EST- Posted in
- Motherboards
Gaming Performance - FPS
As usual, gaming performance was tested with a variety of current games. We ran benchmarks with our standard 1280x1024 resolution. Given the number of users that run 19 inch LCDs these days, 1280x1024 represents one of the most commonly used resolutions. We will show 1600x1200 4xAA/8xAF and 1920x1200 4xAA/8XAF results in part four of our roundup when we test the motherboards that are capable of running CrossFire.
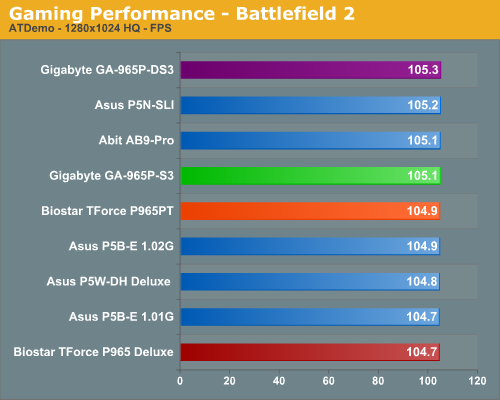
Battlefield 2
This benchmark is performed using DICE's built-in demo playback functionality with additional capture capabilities designed in house. During the benchmark, the camera switches between players and vehicles in order to capture the most action possible. There is a significant amount of smoke, explosions, and vehicle usage as this a very GPU intensive Battlefield 2 benchmark. We run Battlefield 2 using the highest quality graphics settings available in the video settings. The game itself is best experienced with average in-game frame rates of 35 and up.
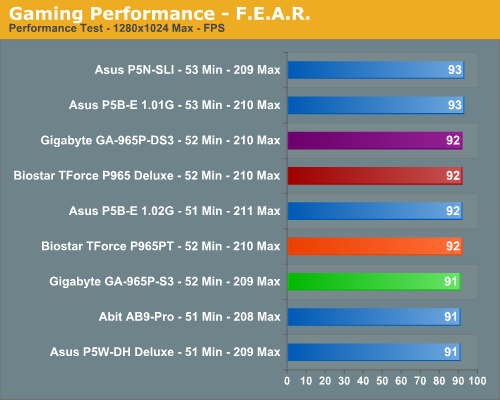
F.E.A.R.
F.E.A.R. uses a built-in performance test that generates graphical test scenes based upon the actual game engine. This test consists of a couple of different action sequences, a stressful water flyby, and heavy use of shadows while traveling through hallways. F.E.A.R. is a very graphics intensive game and we switch all settings to maximum. An average frame rate for F.E.A.R. that can dip into the teens is not good for a first person shooter, but the game is still playable to around 25 fps, although we prefer 35fps.
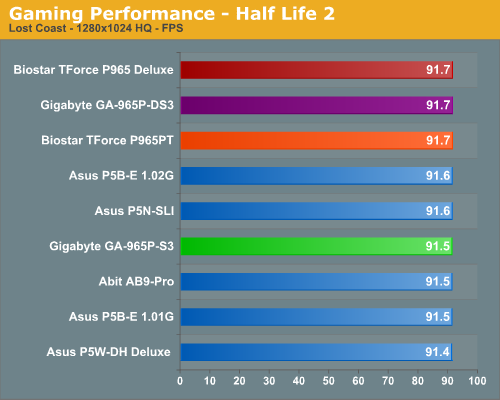
Half Life 2: Lost Coast
We use the built-in timedemo feature to benchmark the game. Our timedemo consists of starting at the bottom of the hill near the lake and ending in the old church. The Source engine timedemo feature is similar to the nettimedemo of Id's Doom 3 engine, in that it plays back more than just the graphics. The highest visual quality settings possible were used with HDR turned on. While the Source engine is notorious for giving great frame rates for almost any hardware setup, we find the game isn't as enjoyable if it isn't running at 35fps or above.
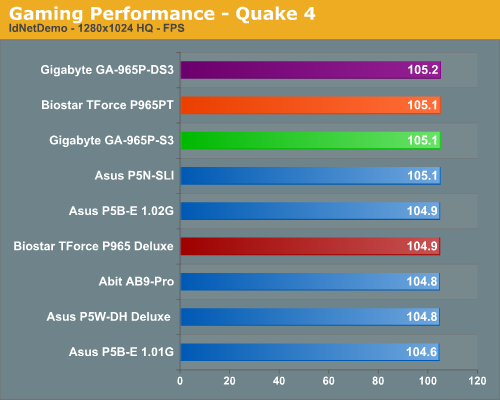
Quake 4
There has always been a lot of debate in the community surrounding pure timedemo benchmarking. We have opted to stick with the nettimedemo test rather than the timedemo option for motherboard benchmarking of Quake 4. To be clear, this means our test results focus mostly on the performance one would experience during actual game play. Additionally, Quake 4 limits frame rate to 60 fps during gameplay whether or not VSync is enabled. Our benchmark utilizes the IdNetDemo. This demo includes mainly outdoor areas with numerous players trying to wipe each other out. We tested the game with High Quality settings (uncompressed normal maps), and we enabled all the advanced graphics options except for VSync.
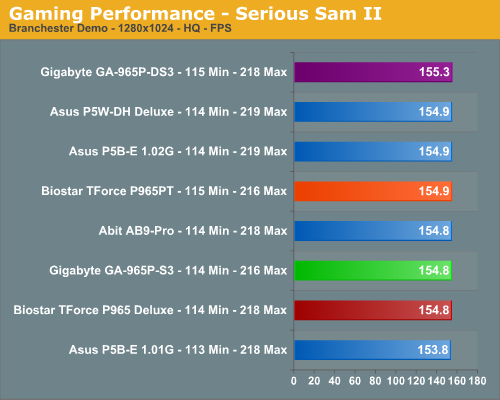
Serious Sam II
This benchmark is performed using Croteam's built-in demo capability in the Serious Sam II engine. We utilize the included Branchester Demo and capture the playback results using the Ctrl-~ function. The benchmark features a large number of combatants, explosions, and general mayhem. The benchmark is primarily GPU sensitive with the actual percentage of GPU/CPU/Audio activity being displayed during the benchmark run. We typically find this game is very playable at average in-game frame rates of 60 and above. We maximize all settings except antialiasing and anisotropic filtering within the general and advanced video settings.
FPS Gaming Summary
What else can you really say after reviewing the results? Once again if you utilize the same chipset you can expect the same basic results during benchmark testing. The differences between each board are minor and during actual game play we could not tell any differences amongst the P965 motherboards tested so far. The Gigabyte GA-965P-DS3 continues to offer the best overall performance by a small margin and except for the Battlefield 2 results the Biostar TForce 965PT offered almost equal performance for significantly less money.
The Gigabyte GA-965P-S3 consistently scored a little lower than the DS3. We did not expect this during testing since both boards are based on the same design along with each BIOS being built on common code. However, it appears the internal memory timings and the MCH timings are a little looser on the S3 resulting in the slightly reduced performance.
We did not experience any issues during testing or during game play with either board. We generally play every game for at least a couple of hours on each board to ensure there are no issues such as overheating, stuttering, or network issues when playing online.
As usual, gaming performance was tested with a variety of current games. We ran benchmarks with our standard 1280x1024 resolution. Given the number of users that run 19 inch LCDs these days, 1280x1024 represents one of the most commonly used resolutions. We will show 1600x1200 4xAA/8xAF and 1920x1200 4xAA/8XAF results in part four of our roundup when we test the motherboards that are capable of running CrossFire.
Battlefield 2
This benchmark is performed using DICE's built-in demo playback functionality with additional capture capabilities designed in house. During the benchmark, the camera switches between players and vehicles in order to capture the most action possible. There is a significant amount of smoke, explosions, and vehicle usage as this a very GPU intensive Battlefield 2 benchmark. We run Battlefield 2 using the highest quality graphics settings available in the video settings. The game itself is best experienced with average in-game frame rates of 35 and up.
F.E.A.R.
F.E.A.R. uses a built-in performance test that generates graphical test scenes based upon the actual game engine. This test consists of a couple of different action sequences, a stressful water flyby, and heavy use of shadows while traveling through hallways. F.E.A.R. is a very graphics intensive game and we switch all settings to maximum. An average frame rate for F.E.A.R. that can dip into the teens is not good for a first person shooter, but the game is still playable to around 25 fps, although we prefer 35fps.
Half Life 2: Lost Coast
We use the built-in timedemo feature to benchmark the game. Our timedemo consists of starting at the bottom of the hill near the lake and ending in the old church. The Source engine timedemo feature is similar to the nettimedemo of Id's Doom 3 engine, in that it plays back more than just the graphics. The highest visual quality settings possible were used with HDR turned on. While the Source engine is notorious for giving great frame rates for almost any hardware setup, we find the game isn't as enjoyable if it isn't running at 35fps or above.
Quake 4
There has always been a lot of debate in the community surrounding pure timedemo benchmarking. We have opted to stick with the nettimedemo test rather than the timedemo option for motherboard benchmarking of Quake 4. To be clear, this means our test results focus mostly on the performance one would experience during actual game play. Additionally, Quake 4 limits frame rate to 60 fps during gameplay whether or not VSync is enabled. Our benchmark utilizes the IdNetDemo. This demo includes mainly outdoor areas with numerous players trying to wipe each other out. We tested the game with High Quality settings (uncompressed normal maps), and we enabled all the advanced graphics options except for VSync.
Serious Sam II
This benchmark is performed using Croteam's built-in demo capability in the Serious Sam II engine. We utilize the included Branchester Demo and capture the playback results using the Ctrl-~ function. The benchmark features a large number of combatants, explosions, and general mayhem. The benchmark is primarily GPU sensitive with the actual percentage of GPU/CPU/Audio activity being displayed during the benchmark run. We typically find this game is very playable at average in-game frame rates of 60 and above. We maximize all settings except antialiasing and anisotropic filtering within the general and advanced video settings.
FPS Gaming Summary
What else can you really say after reviewing the results? Once again if you utilize the same chipset you can expect the same basic results during benchmark testing. The differences between each board are minor and during actual game play we could not tell any differences amongst the P965 motherboards tested so far. The Gigabyte GA-965P-DS3 continues to offer the best overall performance by a small margin and except for the Battlefield 2 results the Biostar TForce 965PT offered almost equal performance for significantly less money.
The Gigabyte GA-965P-S3 consistently scored a little lower than the DS3. We did not expect this during testing since both boards are based on the same design along with each BIOS being built on common code. However, it appears the internal memory timings and the MCH timings are a little looser on the S3 resulting in the slightly reduced performance.
We did not experience any issues during testing or during game play with either board. We generally play every game for at least a couple of hours on each board to ensure there are no issues such as overheating, stuttering, or network issues when playing online.


23 Comments
View All Comments
Gary Key - Thursday, November 9, 2006 - link
It is coming. We had to retest all of the high-end boards with CrossFire capability since the official 6.10 drivers we used generated measurable differences (sometimes better than 7%) in several games compared to the early beta 6.10 drivers. We did not see this issue with our single card testing.Sho - Thursday, November 9, 2006 - link
Ah, ok :). Rock on.JarredWalton - Friday, November 10, 2006 - link
Gary also neglected to tell you about his latest hard drive "testing", in the which he lost many of his in-the-work articles. I keep telling him that he shouldn't stress test his own hardware, but does he listen? Noooo! I really ought to run RAID 1 or start do more frequent backups, come to think of it....