Intel's Core 2 Extreme & Core 2 Duo: The Empire Strikes Back
by Anand Lal Shimpi on July 14, 2006 12:00 AM EST- Posted in
- CPUs
Application Performance using PC WorldBench 5
Looking at the overall WorldBench 5 performance score, Intel's Core platform has a lead of 15% at the high-end and 10% at the low-end.
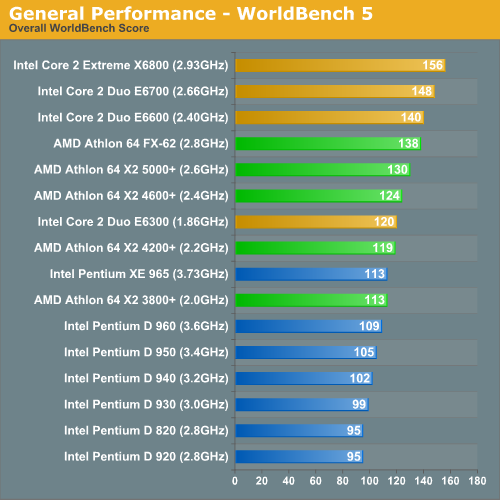
The midrange options show similar results. Of course, the overall performance score is something of an abstraction, so it's also important to look at the individual results. (Click on the images below for detailed results; the numbers are completion times in seconds - lower numbers are better).
Click Images to Enlarge |
||
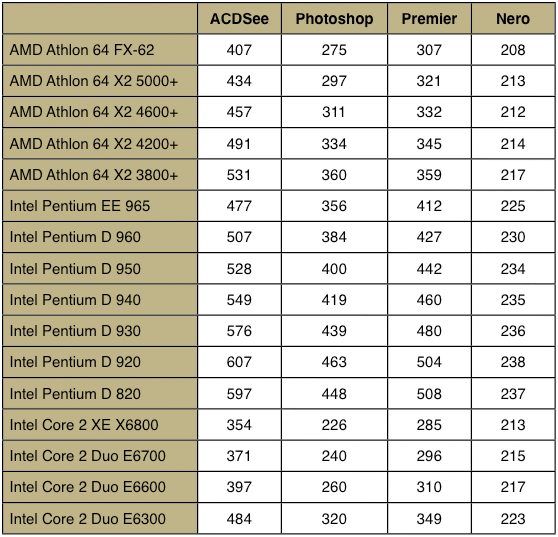 |
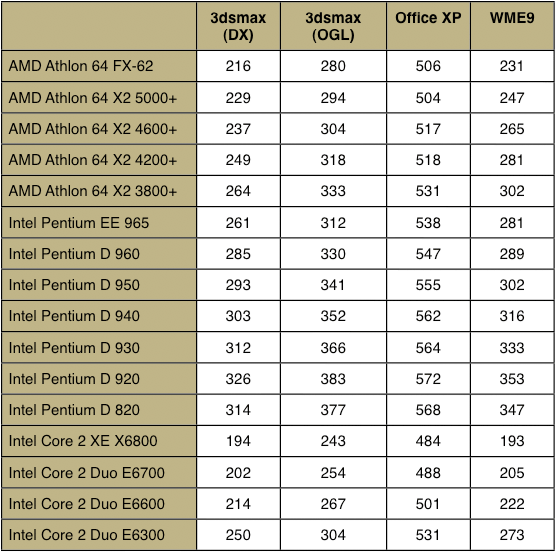 |
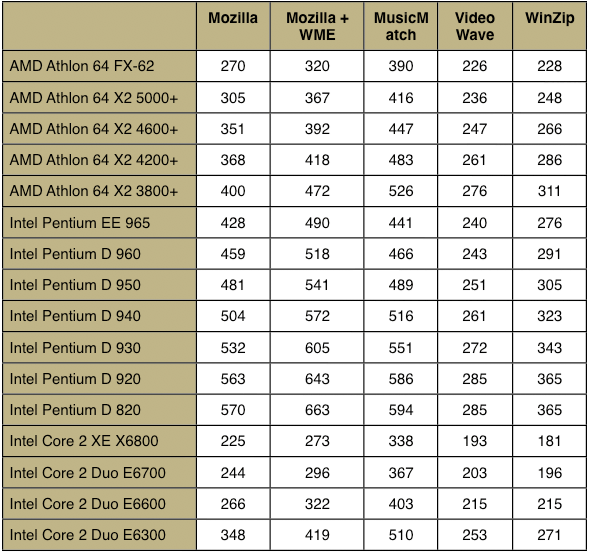 |
Intel leads in almost every instance, with AMD's only win coming in the Ahead Nero Express test. That particular test is mostly I/O limited, however, so the win doesn't particularly count for much. The margins in Adobe Premier, Microsoft Office XP, and 3D Studio Max 5.1 are a bit closer (3%-11%), while the Photoshop, Mozilla, Windows Media Encoder, WinZip, and the multitasking test all favor the Core 2 Duo chips by a slightly larger margin (12%-26%). The net result is clearly a victory for Intel, however.


202 Comments
View All Comments
Anand Lal Shimpi - Friday, July 14, 2006 - link
Corrected, it was a misprint.Take care,
Anand
Zorba - Friday, July 14, 2006 - link
Why is the article talking about how Intel is killing AMD on power consumption when AMD is on the top for both idle and load? If you are doing a performance/watt ratio you need to show that on the graph. This page (page 7) just makes the how article look completely baised.Calin - Friday, July 14, 2006 - link
Because the EE SFF processors were hard to obtain by Anandtech even for testing purposes. I'm not sure they are available in retail market any more than Conroe isAnand Lal Shimpi - Friday, July 14, 2006 - link
The Core 2 Extreme X6800 has a performance per watt score of 0.3575 in WME9 compared to 0.2757 for the X2 3800+ EE SFF. I'll put together a performance per watt graph now and see if I can stick it in there.Take care,
Anand
Anand Lal Shimpi - Friday, July 14, 2006 - link
I included the performance per watt scores I mentioned above in the review now, hopefully that will make things a little more clear.Take care,
Anand
JarredWalton - Friday, July 14, 2006 - link
I don't see the chart, Anand - I hope I didn't accidentally overwrite your change. Sorry!MrKaz - Friday, July 14, 2006 - link
Don't put it because it's a biased chart,Why based on WM9 benchmark? Why not one of the others?
Why put it now, if you never put it when A64 was killing the P4s?
coldpower27 - Friday, July 14, 2006 - link
Because AMD didn't real make a big deal about the performance per watt intiative back in the day. They focused on their price/performance instead.MrKaz - Friday, July 14, 2006 - link
So?Just because Intel focuses now on that Anandtech must be obliged to put it?
So for you where was the price/performance (A64 vs P4) charts on Anandtech reviews?
coldpower27 - Friday, July 14, 2006 - link
Yeah, due to their making people aware of it, it has now become a issue.It was only after Prescott, that we became more aware that thermals were starting to get out of control and paid more attention to wattage numbers.
Price/Performance is not as hard to calculate.