CrossFire Xpress 3200: RD580 for AM2
by Wesley Fink on June 1, 2006 12:05 AM EST- Posted in
- Motherboards
Disk Controller Performance
With the variety of disk drive benchmarks available, we needed a means of comparing the true performance of the wide selection of controllers. The logical choice was Anand's storage benchmark first described in Q2 2004 Desktop Hard Drive Comparison: WD Raptor vs. the World. The iPEAK test was designed to measure "pure" hard disk performance. The hard drive is kept as consistent as possible while varying the hard drive controller; The idea is to measure the performance of a hard drive controller with a consistent hard drive.
We played back Anand's raw files that recorded I/O operations when running a real world benchmark - the entire Winstone 2004 suite. Intel's iPEAK utility was then used to play back the trace file of all IO operations that took place during a single run of Business Winstone 2004 and MCC Winstone 2004. To try to isolate performance differences to the controllers that we were testing, we used the Maxtor 120GB 7200 RPM 8MB cache IDE drive in all IDE tests. SATA1 tests used the 60GB 7200RPM 8MB DiamondMax Plus 9, and SATA2 was tested with the Hitachi 250GB SATA2 drive with SATA2 enabled with the Hitachi utility. The drive was formatted before each test run and a composite average of 5 tests on each controller interface was tabulated in order to ensure consistency in the benchmark.
iPEAK gives a mean service time in milliseconds; in other words, the average time that each drive took to fulfill each IO operation. In order to make the data more understandable, we report the scores as an average number of IO operations per second so that higher scores translate into better performance.
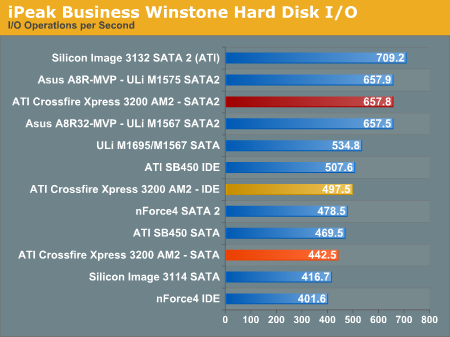
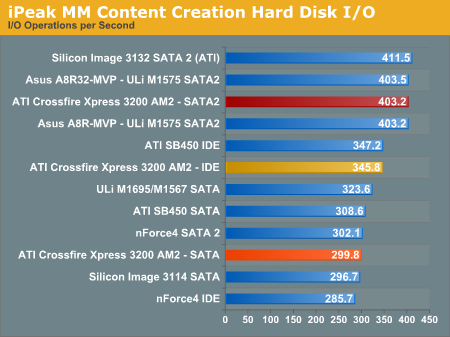
Any concerns about SB600 should be put to rest with these tests. IDE, SATA and SATA2 test results are very competitive with NVIDIA, ULi, and Silicon Image. The performance patterns hold steady across both Multimedia Content IO and Business IO, with the ULi, ATI, and Silicon Image based disk controllers providing the fastest IO operations followed by the on-board NVIDIA nForce4 SATA controllers. The performance generated by the ULi and ATI IDE controller logic is particularly excellent, while the SATA performance of both is up to 12% better when compared to the nForce4 chipset. The SATA performance of the Silicon Image 3132 is very competitive with the core logic chipsets in our tests.
Memory Testing - Optimum tRAS
As expected, DDR2 memory behaves quite differently than DDR in tRAS testing. As you can see from the standard chart below, a 2GB kit of Corsair 8500 (DDR2-1066) experienced steadily increasing bandwidth until the maximum tRAS setting of 18 was reached.
This is a very different pattern than DDR tRAS testing, where maximum bandwidth was reached at some intermediate tRAS setting and bandwidth decreased as tRAS was decreased or increased from this optimum value. In fact, at tRAS 18 we did get the highest bandwidth with all else equal, but the tRAS 18 setting was unstable - causing memory failures and random reboots.
We did further memory testing using Sandra 2007 unbuffered test results and found the optimum combination of bandwidth and stability was achieved at a tRAS setting of 13. Similar results were achieved with the DDR2 8500 Corsair memory on the nForce 590 chipset. We have shared our test results with Corsair and asked for more information on tRAS settings, performance, and stability with high-speed DDR2 memory. All stock benchmarking was performed with Corsair 8500 settings of DDR2-800 at 3-3-3-13 settings at 2.147V.
Memory Bandwidth
Memory bandwidth performance was verified using Sandra 2007. Both buffered and unbuffered tests were run with the stock 4800+ at DDR2-800 3-3-3-13 at 2.147V.
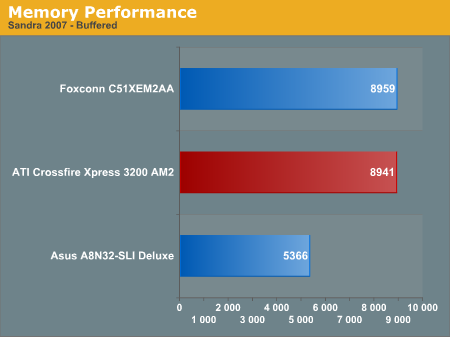
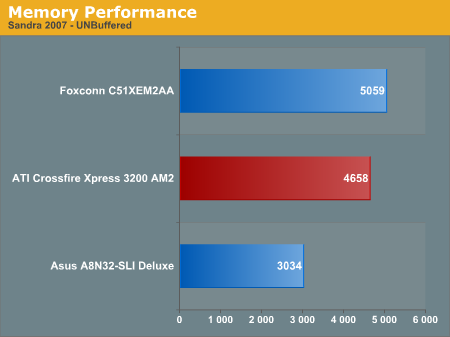
Both standard Buffered Sandra 2007 Memory Performance and Unbuffered Performance are almost identical in the ATI RD580 AMD and the NVIDIA 590 chipsets. This clearly demonstrates that both architectures perform about the same using the same memory and the same CPU with on-board AM2 memory controller. Any differences between the ATI and NVIDIA AM2 memory scores are likely the result of memory tweaking.
You can clearly see the AM2 processor exhibits dramatically higher memory bandwidth than the Athlon64 in Socket 939 running DDR memory. Unfortunately, that much improved memory bandwidth does not currently translate into similarly improved performance.
With the variety of disk drive benchmarks available, we needed a means of comparing the true performance of the wide selection of controllers. The logical choice was Anand's storage benchmark first described in Q2 2004 Desktop Hard Drive Comparison: WD Raptor vs. the World. The iPEAK test was designed to measure "pure" hard disk performance. The hard drive is kept as consistent as possible while varying the hard drive controller; The idea is to measure the performance of a hard drive controller with a consistent hard drive.
We played back Anand's raw files that recorded I/O operations when running a real world benchmark - the entire Winstone 2004 suite. Intel's iPEAK utility was then used to play back the trace file of all IO operations that took place during a single run of Business Winstone 2004 and MCC Winstone 2004. To try to isolate performance differences to the controllers that we were testing, we used the Maxtor 120GB 7200 RPM 8MB cache IDE drive in all IDE tests. SATA1 tests used the 60GB 7200RPM 8MB DiamondMax Plus 9, and SATA2 was tested with the Hitachi 250GB SATA2 drive with SATA2 enabled with the Hitachi utility. The drive was formatted before each test run and a composite average of 5 tests on each controller interface was tabulated in order to ensure consistency in the benchmark.
iPEAK gives a mean service time in milliseconds; in other words, the average time that each drive took to fulfill each IO operation. In order to make the data more understandable, we report the scores as an average number of IO operations per second so that higher scores translate into better performance.
Any concerns about SB600 should be put to rest with these tests. IDE, SATA and SATA2 test results are very competitive with NVIDIA, ULi, and Silicon Image. The performance patterns hold steady across both Multimedia Content IO and Business IO, with the ULi, ATI, and Silicon Image based disk controllers providing the fastest IO operations followed by the on-board NVIDIA nForce4 SATA controllers. The performance generated by the ULi and ATI IDE controller logic is particularly excellent, while the SATA performance of both is up to 12% better when compared to the nForce4 chipset. The SATA performance of the Silicon Image 3132 is very competitive with the core logic chipsets in our tests.
Memory Testing - Optimum tRAS
As expected, DDR2 memory behaves quite differently than DDR in tRAS testing. As you can see from the standard chart below, a 2GB kit of Corsair 8500 (DDR2-1066) experienced steadily increasing bandwidth until the maximum tRAS setting of 18 was reached.
| Memtest86 Bandwidth ATI CrossFire Xpress 3200 AM2 with Athlon X2 4800+ |
|
| 6 tRAS | 2047 |
| 7 tRAS | 2047 |
| 8 tRAS | 2047 |
| 9 tRAS | 2047 |
| 10 tRAS | 2047 |
| 11 tRAS | 2140 |
| 12 tRAS | 2140 |
| 13 tRAS | 2191 |
| 14 tRAS | 2191 |
| 15 tRAS | 2242 |
| 16 tRAS | 2242 |
| 17 tRAS | 2298 |
| 18 tRAS | 2298 |
This is a very different pattern than DDR tRAS testing, where maximum bandwidth was reached at some intermediate tRAS setting and bandwidth decreased as tRAS was decreased or increased from this optimum value. In fact, at tRAS 18 we did get the highest bandwidth with all else equal, but the tRAS 18 setting was unstable - causing memory failures and random reboots.
We did further memory testing using Sandra 2007 unbuffered test results and found the optimum combination of bandwidth and stability was achieved at a tRAS setting of 13. Similar results were achieved with the DDR2 8500 Corsair memory on the nForce 590 chipset. We have shared our test results with Corsair and asked for more information on tRAS settings, performance, and stability with high-speed DDR2 memory. All stock benchmarking was performed with Corsair 8500 settings of DDR2-800 at 3-3-3-13 settings at 2.147V.
Memory Bandwidth
Memory bandwidth performance was verified using Sandra 2007. Both buffered and unbuffered tests were run with the stock 4800+ at DDR2-800 3-3-3-13 at 2.147V.
Both standard Buffered Sandra 2007 Memory Performance and Unbuffered Performance are almost identical in the ATI RD580 AMD and the NVIDIA 590 chipsets. This clearly demonstrates that both architectures perform about the same using the same memory and the same CPU with on-board AM2 memory controller. Any differences between the ATI and NVIDIA AM2 memory scores are likely the result of memory tweaking.
You can clearly see the AM2 processor exhibits dramatically higher memory bandwidth than the Athlon64 in Socket 939 running DDR memory. Unfortunately, that much improved memory bandwidth does not currently translate into similarly improved performance.


71 Comments
View All Comments
Gary Key - Thursday, June 1, 2006 - link
Wes's original hard drive met an untimely death during testing. However, the chart is incorrect as the Maxtor drive has a 16MB cache also and in our IPEAK tests the two drives are very comparable if not the same. We did not see any differences in the game scores and PCMark was off about 20 points, well within the margin of error for testing for this application.