Seagate Barracuda 7200.10 750GB: Size Does Matter
by Gary Key on May 18, 2006 9:00 AM EST- Posted in
- Storage
Actual Application Times
Our application time tests are designed to show application performance results with times being reported in minutes / seconds or seconds only with lower scores being better. While these tests will show some differences between the drives it is important to understand we are no longer measuring the pure performance of the hard drive but how well our platform performs with each individual drive. The performance of a hard drive is an integral part of the computer platform but other factors such as memory, CPU, core logic, and even driver choice can play a major role in determining how well the hard drive performs in any given task.Game Load Tests
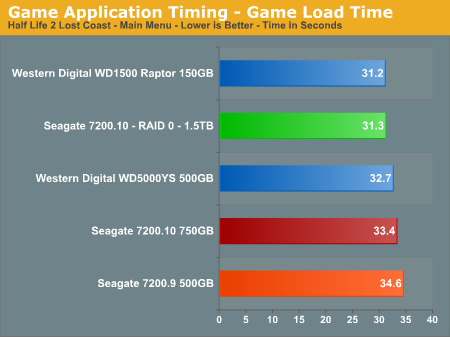
In our Half Life 2 - Lost Coast test we measure the time it takes to load the game with the application timer starting when the play game icon is initiated in the Steam menu until the Main game menu appears. The results follow our overall IPEAK game results with the Western Digital drives performing up to 10% better in this benchmark. The Seagate RAID 0 setup almost surpasses the WD Raptor in this test and performs slightly better than the single 750GB drive. We are still trying to develop a repeatable trace file for this game to include in our IPEAK test suite as the game has one of the longer loading sequences in our test library.
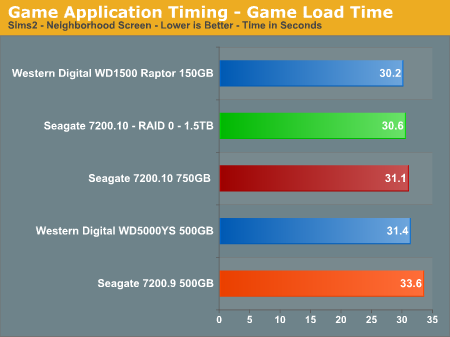
Our Sims 2 - Open for Business test measures the time it takes to load the initial portion of the game. Our application timer starts when the game icon is initiated until the neighborhood menu appears. The results are slightly different than our IPEAK results with the Seagate 7200.10 finishing ahead of the WD RE2 500GB drive. The RAID 0 setup offers a 1% improvement in this benchmark. The WD Raptor continues to lead all drives but the actual differences are so minor that any drive in our test roundup will be more than acceptable for general game play.
Game Level Load Tests
Our tests center around the actual loading of a playable level within our game selections.
- The Half Life 2 - Lost Coast test measures the time it takes to load a new game. Our application timer starts when the start new game icon is initiated and ends when the character is on screen with the 357 magnum visible.
- The Sims 2 - Open for Business test measures the time it takes to load the Downtown sector of the game from Veronaville. Our application timer starts when the Downtown game icon is initiated and ends when the downtown graphics are visible.
- The Battlefield 2 test measures the time it takes to load the Daqing Oilfields level. Our application timer begins when the start singleplayer icon is initiated and ends when the join game icon is visible.
- The Oblivion test measures the time it takes to load the Weye level in our saved game files. Our application timer begines when the load saved game icon is initiated and ends when the character is visible on screen.
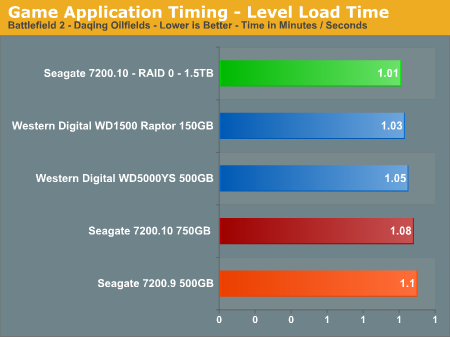
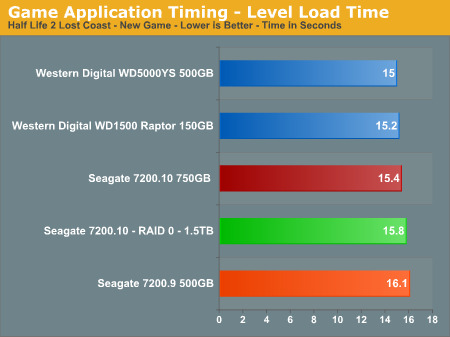
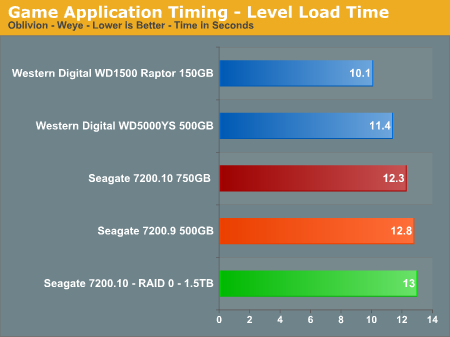
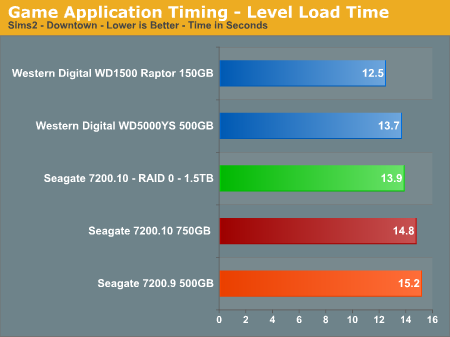
The WD Raptor continues its pattern of being the best available drive for the game enthusiast, although with a limited storage capacity it is certainly an expensive proposition for the general desktop user who typically will sacrifice speed for storage. RAID 0 finally shows up to the party and offers a 7% improvement in the Battlefield 2 scores but otherwise does not offer any tangible benefits, and it even posts slower load times in the Oblivion and Half Life 2 benchmarks. The Seagate 7200.10 does show improvements over the 7200.9 series and is competitive with the WD RE2 500GB drive these benchmarks.
WinRAR 3.51 Tests
Our WinRAR tests measure the time it takes to compress our test folder that contains 444 files, 10 folders, and contains 602MB of data. This is same test folder utilized in our IPEAK test suite. While the benchmark is extremely CPU intensive for the compression test it still requires a fast storage system to keep pace with the CPU.
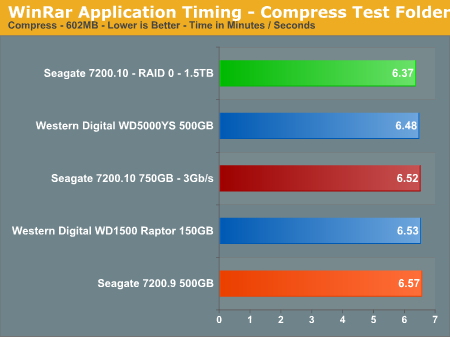
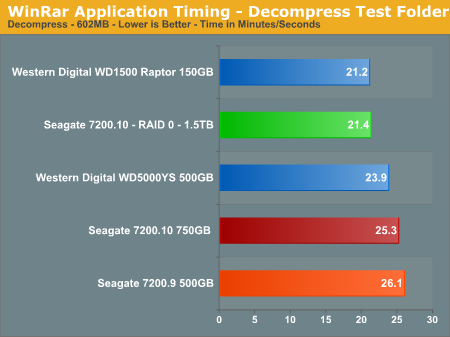
The compression tests mimic our IPEAK results with the WD RE2 500GB drive having the top score, followed by the Seagate 7200.10 unit. RAID 0 offers a 3% improvement in this benchmark where CPU choice is critical. In our testing with version 3.63 that fully supports multithreading, our dual core processor offers up to a 53% improvement in this benchmark. In our decompression test all of the drives are within a couple of percent of each other, with the Raptor back in the lead and our RAID 0 setup almost equaling its score.
AnyDVD 5.9.6
Our final test has us utilizing the "ripping" function of AnyDVD to copy the Office Space DVD file from our source drive to our test drive. Our DVD features 29 files totaling 7.55GB of data and is an excellent test for determining the write speed of a drive.
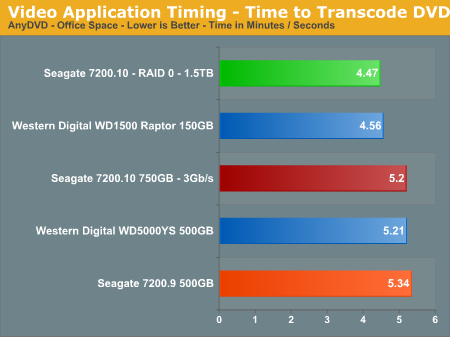
The test results show what we all know: speed kills. In this case, the WD Raptor posts an impressive score with the WD RE2 and Seagate 7200.10 finishing 13% behind. Our RAID 0 setup wakes up and finally takes a first place finish as the large sequential writes in this test are a natural fit for this setup. The Seagate 7200.10 continues to offer slightly better performance than the 7200.9 while providing a 50% increase in storage space, perfect for the audio/video enthusiast.


44 Comments
View All Comments
Larso - Monday, May 22, 2006 - link
Well, you usually plot dB on a linear axis, taken for granted that the interpreter knows the exponential nature of decibels (+10 dB sounds like doubling the loudness). But since our ears/brain also interpret sound levels in an exponential fashion, its not _that_ misleading...
If you really want to show the soundlevel in a linear fashion, you would have to measure loudness in http://en.wikipedia.org/wiki/Sone">Sone
- Gary: Sorry if I've missed it, when you measured the loudness, was the drive secured to the case with screws, or was it suspended softly? It would be interesting to know how much of the noise was due to vibration, and how much was actual noise emission from the drive.
Perhaps some kind of soft suspension would make the drive noise more bearable, subjectively?
Gary Key - Thursday, May 25, 2006 - link
The drives are suspended via soft rubber bushings in the drive cage in order to equalize the test results between drives (as much as possible). This drive will create an additional low pitch vibration when attached directly but nothing like the sound a Raptor produces when attached directly, subjective opinion of course. :)
TonyB - Thursday, May 18, 2006 - link
how soon till we see 1TB hard drive. 7200.11?Gary Key - Thursday, May 18, 2006 - link
We should see a 960GB drive by Q4. We will see the 1TB+ drives in 2007, maybe earlier depending on how well the new 200GB plus platters test out. Also, if Hitachi or WD press Seagate on the issue in Q4 I am sure it be out early. ;->Zaitsev - Thursday, May 18, 2006 - link
Page 4 reads, "we decided the make the switch at this time as the performance."I enjoyed the article, Gary.
"I would much rather show the benefits of RAID 5, 0+1, 10 in a separate article"
I think that's a great idea, and am looking forward to it.
Gary Key - Thursday, May 18, 2006 - link
The link highlight on the word "applications" right before "we" is hiding the semi-colon somewhat. I will see if we can edit the hyperlink to correct this. :)
Thanks for the comments. We are trying to head in a more technical direction in the storage section. We have some additional audio/video tests coming along with application timer benchmarks that should lighten up the presentation. Also, we did not report WB99, IPEAK Access, Disk Bench, IOMeter, or other benchmarks yet, still gauging what information is valuable, interesting, and required.
JarredWalton - Thursday, May 18, 2006 - link
Actually, he was referring to the word "the" - fixed now, as it should have been "to". :)Zaitsev - Thursday, May 18, 2006 - link
Sorry about that. I will be more clear next time. :)Gary Key - Thursday, May 18, 2006 - link
I will wear my glasses next time.... LOL
peternelson - Thursday, May 18, 2006 - link
Hi,
I can understand why you want to test sound levels as close as 5mm.
However, to someone quickly looking at the results charts without carefully reading the text they might think your db(A)@5mm are comparable with db(A) measurements taken at more conventional distances like 1 metre away.
To avoid such errors being made when comparing BETWEEN reviews, please clearly label the audio charts not just "db" but "db(A)@5mm"