The Intel Core i3-13100F Review: Finding Value in Intel's Cheapest Core Chip
by Gavin Bonshor on April 20, 2023 9:00 AM ESTCPU Benchmark Performance: Power And Office
Our previous sets of ‘office’ benchmarks have often been a mix of science and synthetics, so this time we wanted to keep our office section purely on real-world performance. We've also incorporated our power testing into this section too.
The biggest update to our Office-focused tests for 2023 and beyond include UL's Procyon software, which is the successor to PCMark. Procyon benchmarks office performance using Microsoft Office applications, as well as Adobe's Photoshop/Lightroom photo editing software, and Adobe Premier Pro's video editing capabilities. Due to issues with UL Procyon and the video editing test, we haven't been able to properly run these, but once we identify a fix with UL, we will re-test each chip.
We are using DDR5-4800 memory on the Intel Core i3-13100F as per the JEDEC specifications. Other recent chips, such as Intel's 13th/12th Gen Core series and Ryzen 7000 processors, are also tested at the rated JEDEC specifications. We tested the aforementioned platforms with the following settings:
- DDR5-5600B CL46 - Intel 13th Gen
- DDR5-5200 CL44 - Ryzen 7000
- DDR5-4800 (B) CL40 - Intel 12th Gen
- DDR5-4800 (B) CL40 - Intel 13th Gen Core i3 series
All other CPUs such as Ryzen 5000 and 3000 were tested at the relevant JEDEC settings as per the processor's individual memory support with DDR4.
Power
The nature of reporting processor power consumption has become, in part, a bit of a nightmare. Historically the peak power consumption of a processor, as purchased, is given by its Thermal Design Power (TDP, or PL1). For many markets, such as embedded processors, that value of TDP still signifies the peak power consumption. For the processors we test at AnandTech, either desktop, notebook, or enterprise, this is not always the case.
Modern high-performance processors implement a feature called Turbo. This allows, usually for a limited time, a processor to go beyond its rated frequency. Exactly how far the processor goes depends on a few factors, such as the Turbo Power Limit (PL2), whether the peak frequency is hard coded, the thermals, and the power delivery. Turbo can sometimes be very aggressive, allowing power values 2.5x above the rated TDP.
AMD and Intel have different definitions for TDP that are, broadly speaking, applied the same. The difference comes from turbo modes, turbo limits, turbo budgets, and how the processors manage that power balance. These topics are 10000-12000 word articles in their own right, and we’ve got a few articles worth reading on the topic.
- Why Intel Processors Draw More Power Than Expected: TDP and Turbo Explained
- Talking TDP, Turbo and Overclocking: An Interview with Intel Fellow Guy Therien
- Reaching for Turbo: Aligning Perception with AMD’s Frequency Metrics
- Intel’s TDP Shenanigans Hurts Everyone
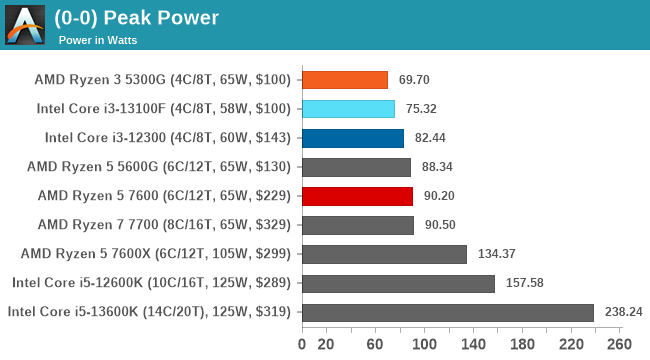
Looking at the peak power values for all of the sub $350 CPUs we've tested with the latest CPU suite, the Core i3-13100F, as expected draws the least power overall. The difference between the Core i3-13100F and the Core i3-12300 is around 7 W, which isn't massive, especially given they have the same Intel Golden Cove performance cores.
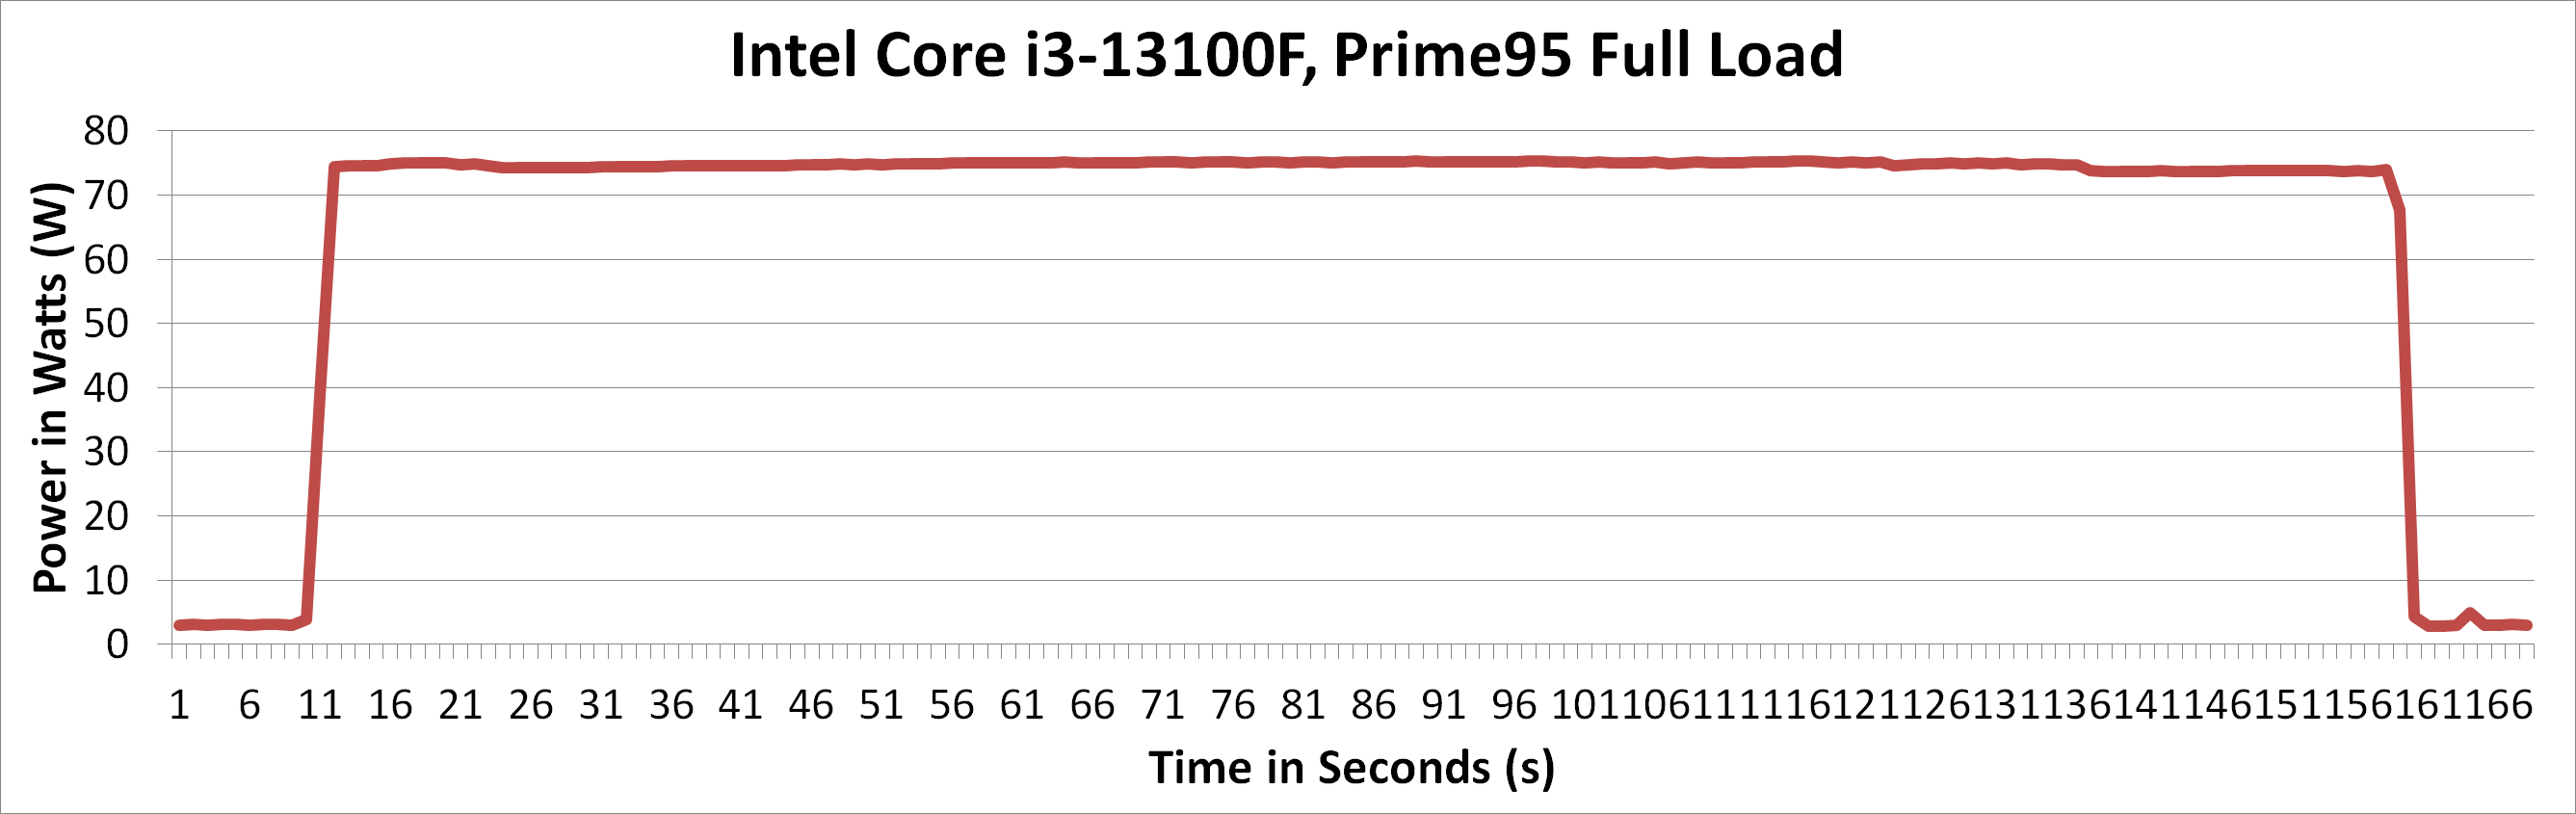
Diving into the power consumption of the Core i3-13100F during a Prime95 sustained load, we found that power was delivered consistently between 72 and 75 W, with no drop in frequency and power unless the compute load itself dropped off. This means that peak power is delivered for the duration when at full load. It also shows that Intel's Core i3-13100F is performing well within the associated turbo TDP power limit of 89 W.
Office/Web
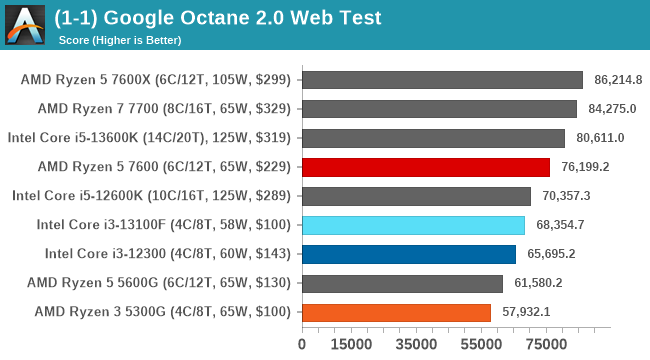
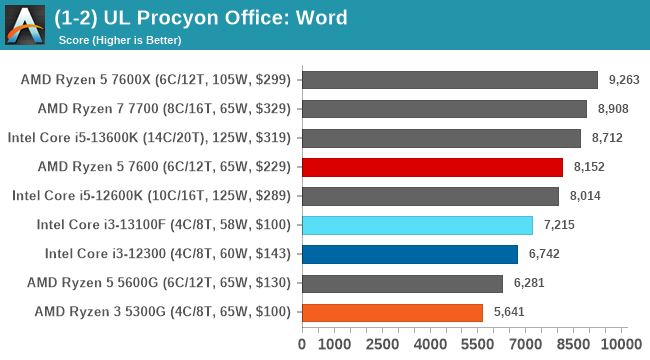
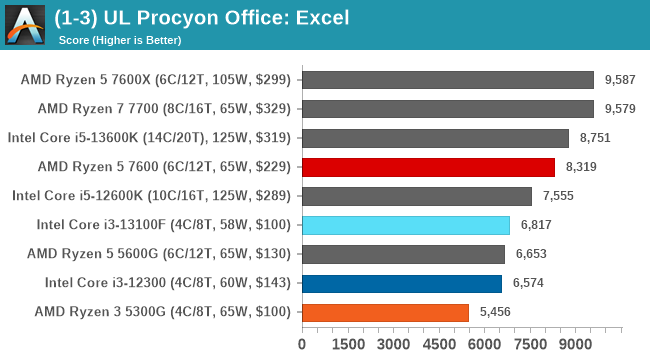
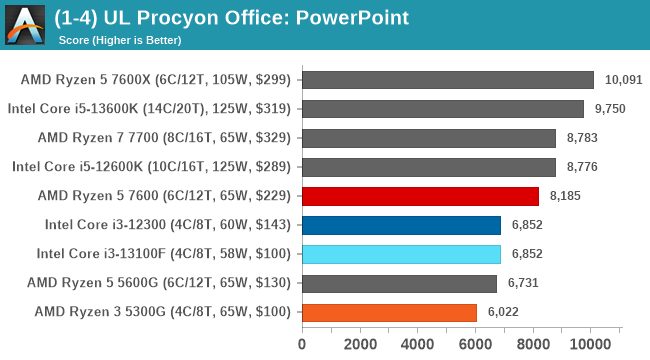
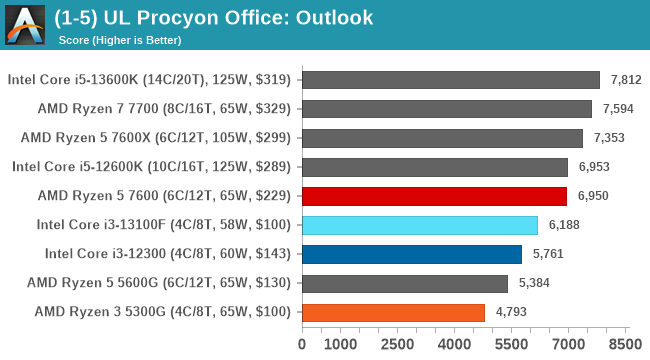
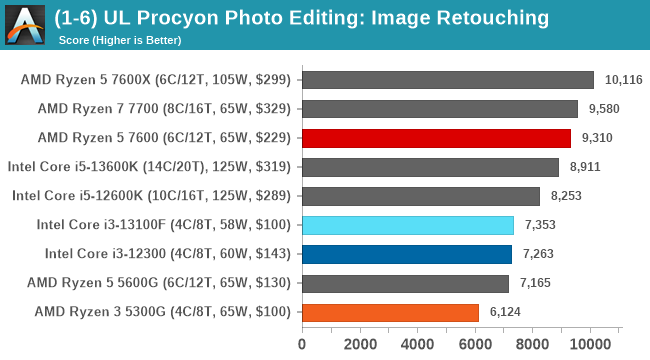
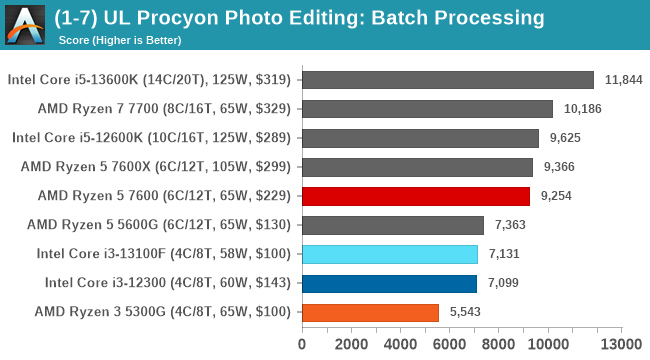
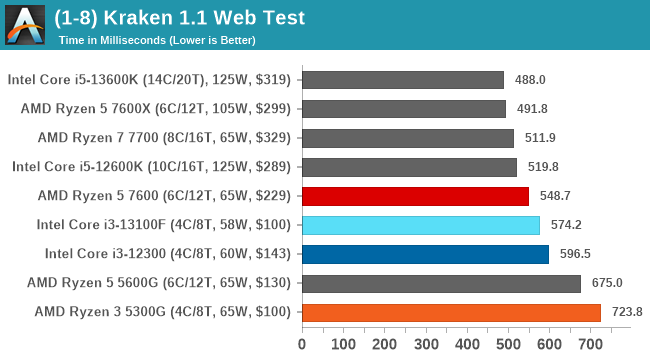
In office and productivity based benchmarks, the Core i3-13100F does very well considering it's a quad-core chip pitted up against six, eight, and even the Core i5-13600K, which is a 14C/20T part. As expected, the Core i3-13100F is slightly better than the Core i3-12300 as it has slightly faster cores.
Comparing Intel's latest quad-core to AMD's most recent quad-core, Intel has a distinct advantage in IPC performance as it's a newer process (Raptor/Alder Lake versus Zen 3) and clock speeds.


34 Comments
View All Comments
Otritus - Thursday, April 20, 2023 - link
For this generation Intel technically only offers a single i3 tier, the i3-13100, which is further broken up into three configurations: the base version, the 35W TDP sion (i3-13100T), and finally a version without working integrated graphics, the i3-13100F.I think you mean the 35W TDP version, instead of sion.
Otritus - Thursday, April 20, 2023 - link
Dissecting a little deeper into the pricing, the Core i3-13100F costs roughly $25 per core, which drops to $22 per core on the Core i5-13600K, which is cheaper per core, but it should also be reminded that six of these are P-cores and eight are slightly lower E-cores.Do you mean slightly slower E-cores, not lower? I'd also list them as slower, as E-cores are basically just Skylake and Golden Cove is much faster than Skylake.
Ryan Smith - Friday, April 21, 2023 - link
Yeah, slower. Or more specifically, lower performing.Otritus - Thursday, April 20, 2023 - link
The performance cores of the Core i3-13100F feature a base clock of 3.5 GHz, with an all-core turbo of 4.5 GHz.I think you mean a base clock of 3.4GHz, not 3.5.
jeromec - Friday, April 21, 2023 - link
Good article so far (I only read page 1). Thanks.But why is there no mention that it is about desktop CPUs?
There are Core i3 CPUs for notebooks too.
WhatYaWant - Friday, April 21, 2023 - link
Some of the benchmarks looks a bit fishy. How can the 7600 beat the 7600x?meacupla - Friday, April 21, 2023 - link
der8auer did a video on this recently.It's silicon lottery. It's entirely possible that Anandtech has a golden sample 7600 with an average 7600X.
Ryan Smith - Friday, April 21, 2023 - link
I don't consider either chip to be a golden sample in any way. But given the nearly identical potential for lightly-threaded performance, when you run enough benchmarks at some point you're going to see the non-X win just due to statistical probabilities. Which is part of the reason why we never base our recommendations off of a single title.https://xkcd.com/882/
Bruzzone - Friday, April 21, 2023 - link
Raptor i3s = 3.2% of 13th desktop full run production to date and for Alder 3.7%. 13100F itself = 0.004% of all Raptor and 12100F = 0.68% of all Alder.For the week Alder full line = 69% more than all Raptor WW channel available today and on a full line run to date basis from day 1, Alder desktop production volume is 713% more than Raptor.
Specific Alder if you're looking for a deal, Alder suspect run end sales reward seen in end of quarter specific SKU volume gains indicate 900K_, 700K, 600K, 500, 400, 100, G6900 are offered moving into q2 sales (renewed) commitment as OEM q1 contract completion reward meaning no charge and in the week represent 69% of all Alder desktop available so a sizeable release of overage 'slack' product at run end. Knowing this, in the channel you get what you negotiate.
On the AMD side, 4500 dreg was AMD q1 channel reward and they sold well in PCs disguised as 3600.
There is very little 5300G/GE availability and adding 5500 Vermeer = 30% more than all Raptor available i3 in the week. 5500 itself is 600% more volume available than 5300_ and #3 available behind #2 5700G and #1 5600G at 161% more than 5500.
mb
TomWomack - Friday, April 21, 2023 - link
Did you not have an i3-13100 available? It seems unusually unrealistic to test a $100 CPU with a $630 video card, when they will almost always be used with their integrated video.I have difficulty understanding the use case which saves $25 on the CPU price but requires an external GPU, when the absolute cheapest GPU is well over $25