Intel Core i9-13900K and i5-13600K Review: Raptor Lake Brings More Bite
by Gavin Bonshor on October 20, 2022 9:00 AM ESTCPU Benchmark Performance: Rendering And Encoding
Rendering tests, compared to others, are often a little more simple to digest and automate. All the tests put out some sort of score or time, usually in an obtainable way that makes it fairly easy to extract. These tests are some of the most strenuous in our list, due to the highly threaded nature of rendering and ray-tracing, and can draw a lot of power.
If a system is not properly configured to deal with the thermal requirements of the processor, the rendering benchmarks are where it would show most easily as the frequency drops over a sustained period of time. Most benchmarks in this case are re-run several times, and the key to this is having an appropriate idle/wait time between benchmarks to allow for temperatures to normalize from the last test.
One of the interesting elements of modern processors is encoding performance. This covers two main areas: encryption/decryption for secure data transfer, and video transcoding from one video format to another.
In the encrypt/decrypt scenario, how data is transferred and by what mechanism is pertinent to on-the-fly encryption of sensitive data - a process by which more modern devices are leaning to for software security.
We are using DDR5 memory on the Core i9-13900K, the Core i5-13600K, the Ryzen 9 7950X, and Ryzen 5 7600X, as well as Intel's 12th Gen (Alder Lake) processors at the following settings:
- DDR5-5600B CL46 - Intel 13th Gen
- DDR5-5200 CL44 - Ryzen 7000
- DDR5-4800 (B) CL40 - Intel 12th Gen
All other CPUs such as Ryzen 5000 and 3000 were tested at the relevant JEDEC settings as per the processor's individual memory support with DDR4.
Rendering
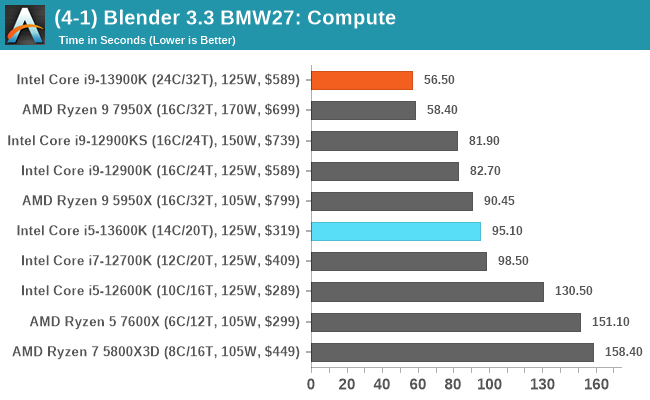

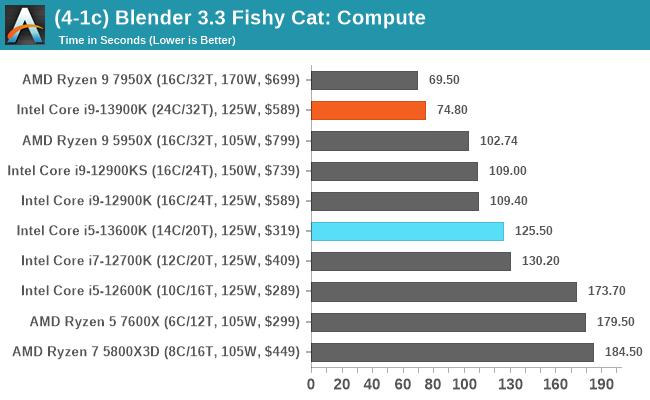
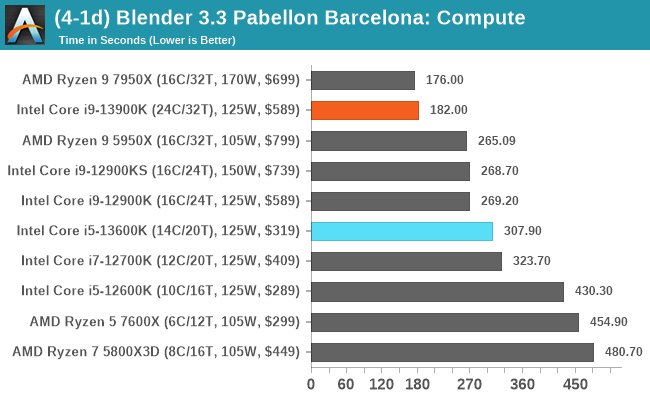
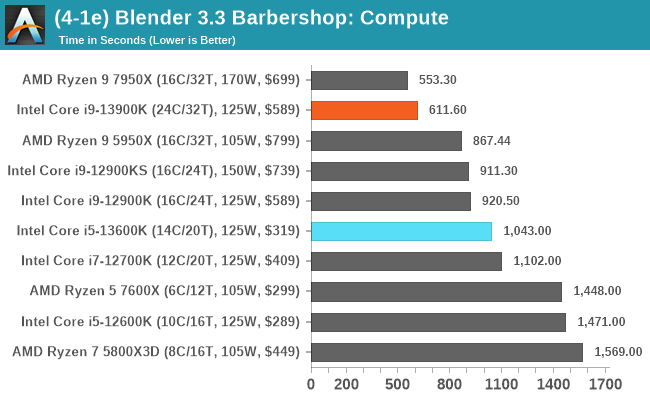
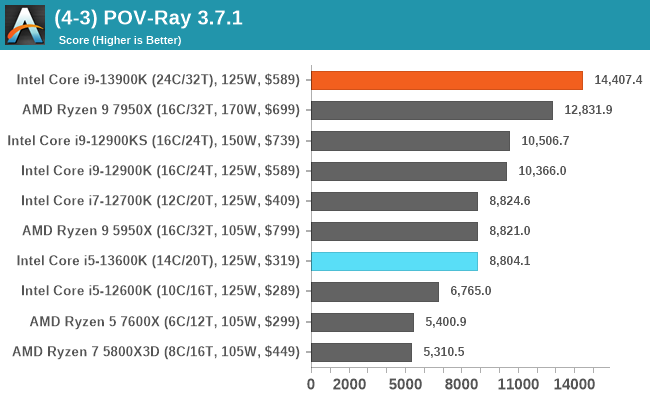
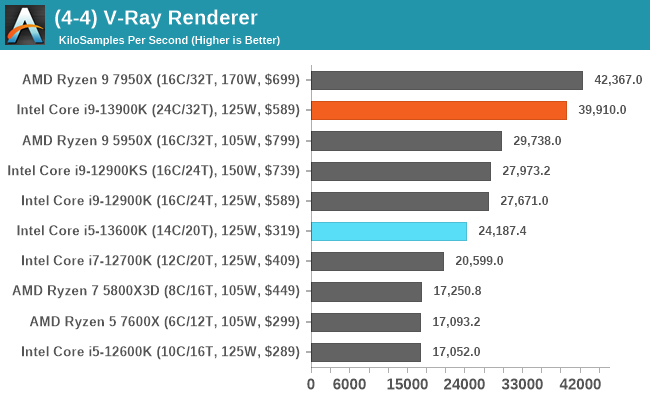
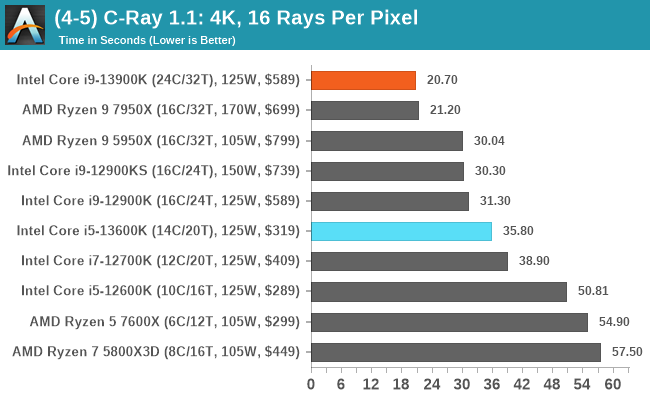
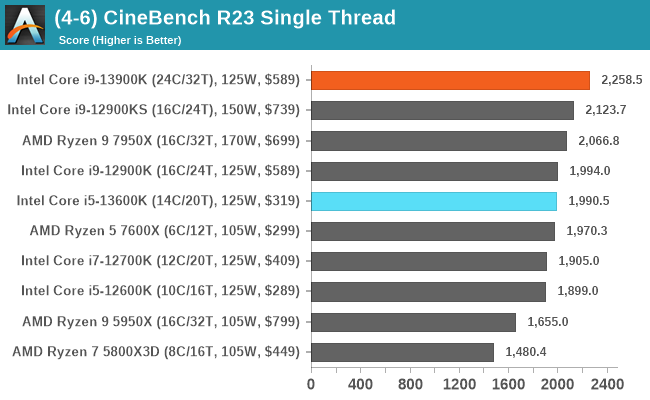
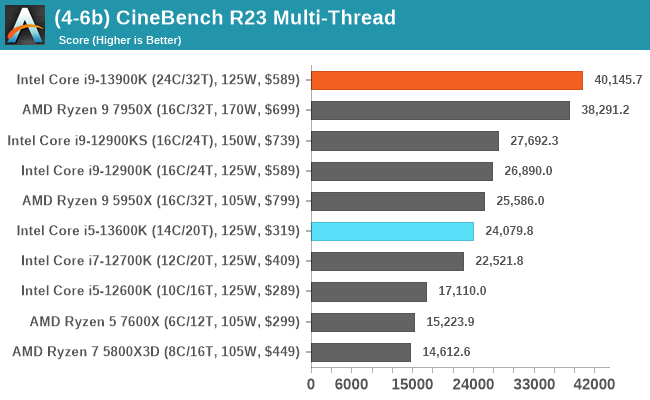
Identifying what core comes where in our rendering tests, both the Core i9-13900K and Ryzen 9 7950X sit comfortably at the top of the tree. Depending on the test, it’s a consistent battle for rendering supremacy. Where things aren’t as close are in our POV-Ray and V-Ray tests, where the Core i9-13900K has a distinct advantage; likely down to having eight more logical cores than the 7950X.
Encoding
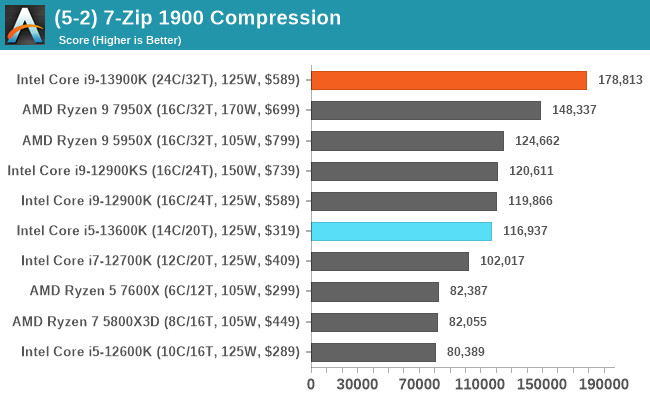
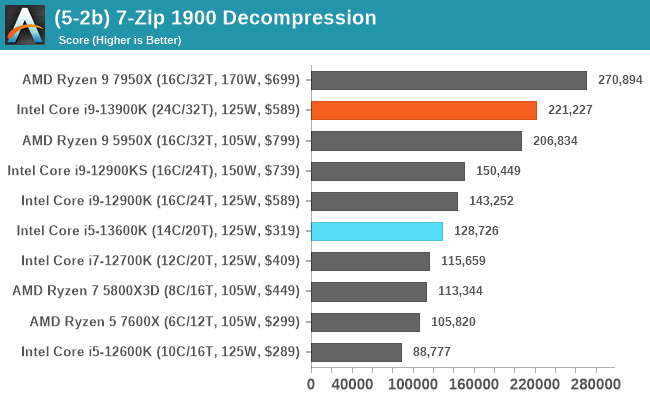
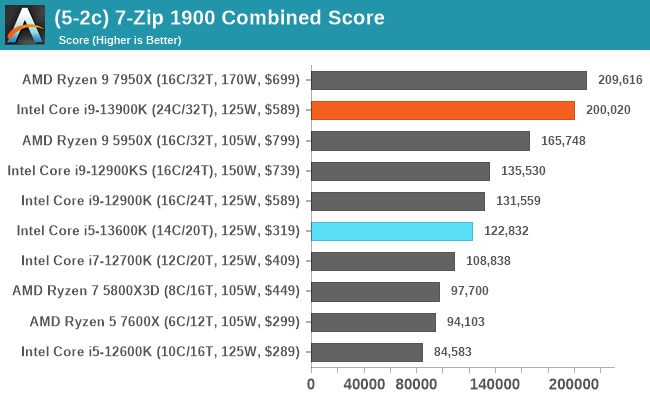
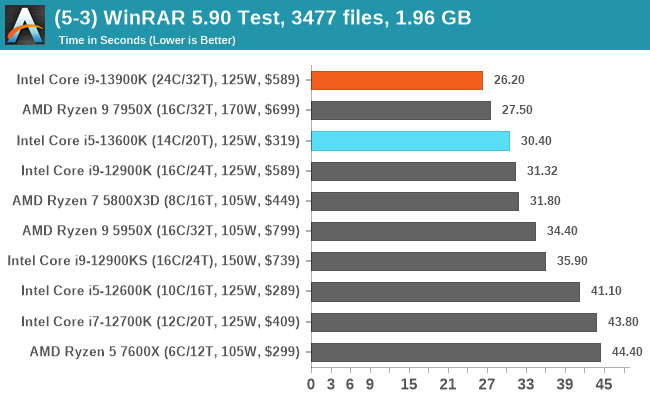
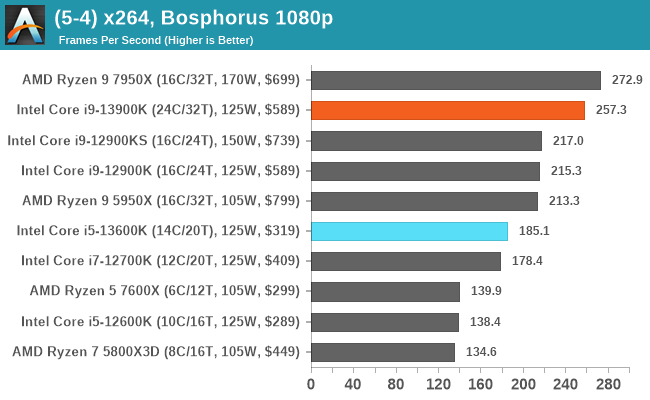
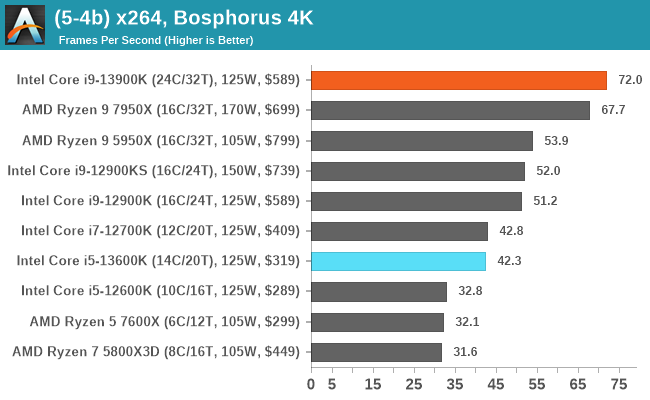
In our encoding tests, interestingly the Core i9-13900K looks to have the advantage in compressing files with 7-Zip. It’s a little different for AMD as the Ryzen 9 7950X decompresses the data better, with the overall combined advantage going to AMD in this particular test. In our updated x264 benchmark, Intel takes the lead in 4K encoding, while AMD has the lead in 1080p encoding; both are equally viable options, however.


169 Comments
View All Comments
mode_13h - Friday, October 21, 2022 - link
"The new instruction cache on Gracemont is actually very unique. x86 instruction encoding is all over the place and in the worst (and very rare) case can be as long as 15 bytes long. Pre-decoding an instruction is a costly linear operation and you can’t seek the next instruction before determining the length of the prior one. Gracemont, like Tremont, does not have a micro-op cache like the big cores do, so instructions do have to be decoded each time they are fetched. To assist that process, Gracemont introduced a new on-demand instruction length decoder or OD-ILD for short. The OD-ILD generates pre-decode information which is stored alongside the instruction cache. This allows instructions fetched from the L1$ for the second time to bypass the usual pre-decode stage and save on cycles and power."Source: https://fuse.wikichip.org/news/6102/intels-gracemo... Reply
Sailor23M - Friday, October 21, 2022 - link
Interesting to see Ryzen 5 7600X perform so well in excel/ppt benchmarks. Why is that so? ReplyMakste - Friday, October 21, 2022 - link
Thank you for the review. So Intel too, is finally throwing more cores and increasing frequencies to the problem these days, which increases heat and power usage in turn. AMD too, is a culprit of this practice but has not gone to these lengths as Intel. 16 cores versus supposedly efficiency cores. What is not happening? Replyricebunny - Friday, October 21, 2022 - link
It would be a good idea to highlight that the MT Spec benchmarks are just N instantiations of the single thread test. They are not indicative of parallel computing application performance. There are a few dedicated SPEC benchmarks for parallel performance but for some reason they are never included in Anandtechs benchmarks. ReplyRyan Smith - Friday, October 21, 2022 - link
"There are a few dedicated SPEC benchmarks for parallel performance but for some reason they are never included in Anandtechs benchmarks."They're not part of the actual SPEC CPU suite. I'm assuming you're talking about the SPEC Workstation benchmarks, which are system-level benchmarks and a whole other kettle of fish.
With SPEC, we're primarily after a holistic look at the CPU architecture, and in the rate-N workloads, whether there's enough memory bandwidth and other resources to keep the CPU cores fed. Reply
wolfesteinabhi - Friday, October 21, 2022 - link
its strange to me that when we are talking about value ...especially for budget constraint buyers ... who are also willing to let go of bleeding edge/performance ... we dont even mention AM4 platform.AM4 is still good ..if not great (not to say mature/stable) platform for many ..and you can still buy a lot of reasonably price good procs including 5800X3D ...and users have still chance to upgrade it upto 5950X if they need more cpu at a later date. Reply
cowymtber - Friday, October 21, 2022 - link
Burning hot POS. ReplyBernieW - Friday, October 21, 2022 - link
Disappointed that you didn't spend more time investigating the serious regression for the 13900K vs the 12900K in the 502.gc_r test. The single threaded test does not have the same regression so it's a curious result that could indicate something wrong with the test setup. Alternately, perhaps the 13900K was throttling during that part of the test or maybe E cores are really not good at compiling code. ReplyAvalon - Friday, October 21, 2022 - link
I had that same thought. Why publish something so obviously anomalous and not even say anything about it? Did you try re-testing it? Did you accidentally flip the scores between the 12th and 13th gen? There's no obvious reason this should be happening given the few changes between 12th and 13th gen cores. ReplyRyan Smith - Friday, October 21, 2022 - link
"Disappointed that you didn't spend more time investigating the serious regression for the 13900K vs the 12900K in the 502.gc_r test."We still are. That was flagged earlier this week, and re-runs have produced the same results.
So at this point we're digging into matters a bit more trying to figure out what is going on, as the cause is non-obvious. I'm thinking it may be a thread director hiccup or an issue with the ratio of P and E cores, but there's a lot of different (and weird) ways this could go. Reply