Intel Core i9-13900K and i5-13600K Review: Raptor Lake Brings More Bite
by Gavin Bonshor on October 20, 2022 9:00 AM ESTGaming Performance: 720p And Lower
The reason we test games in CPU reviews at lower resolutions such as 720p and below is simple; titles are more likely to be CPU bound than they are GPU bound at lower resolutions. This means there are more frames for the processor to process as opposed to the graphics card doing the majority of the heavy lifting.
There are some variances where some games will still use graphical power, but not as much CPU grunt at these smaller resolutions, and this is where we can show where CPU limitations lie in terms of gaming.
We are using DDR5 memory on the Core i9-13900K, the Core i5-13600K, the Ryzen 9 7950X, and Ryzen 5 7600X, as well as Intel's 12th Gen (Alder Lake) processors at the following settings:
- DDR5-5600B CL46 - Intel 13th Gen
- DDR5-5200 CL44 - Ryzen 7000
- DDR5-4800 (B) CL40 - Intel 12th Gen
All other CPUs such as Ryzen 5000 and 3000 were tested at the relevant JEDEC settings as per the processor's individual memory support with DDR4.
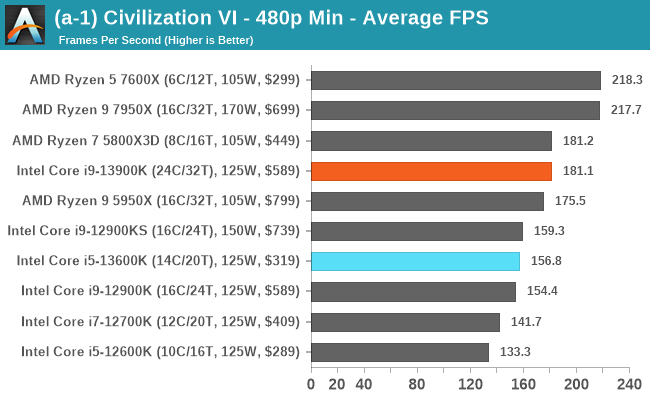
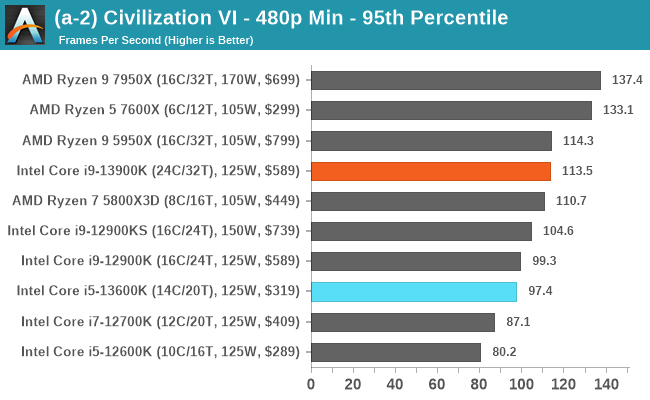
Civilization VI
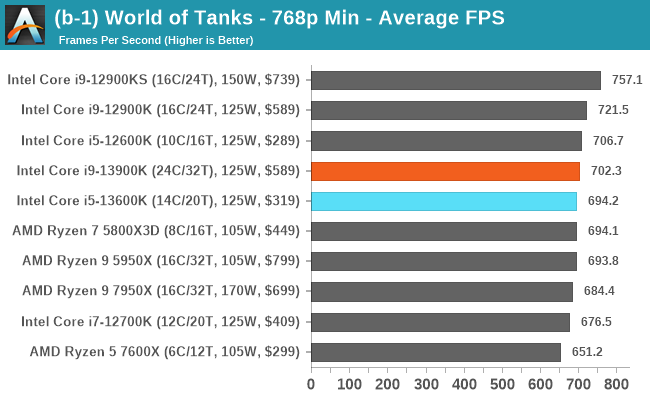
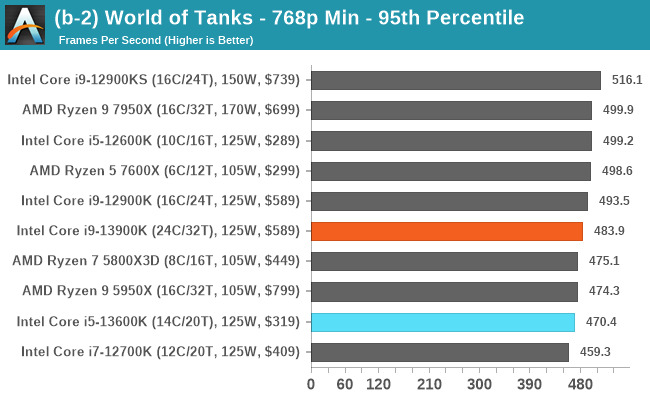
World of Tanks
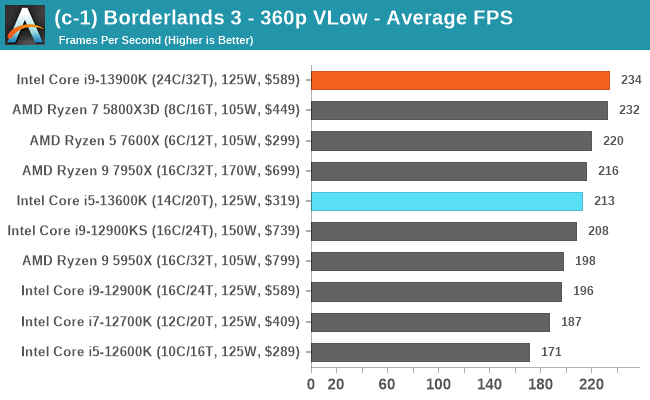
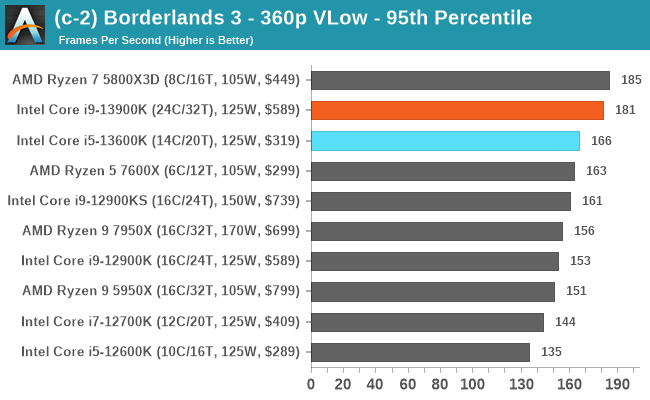
Borderlands 3
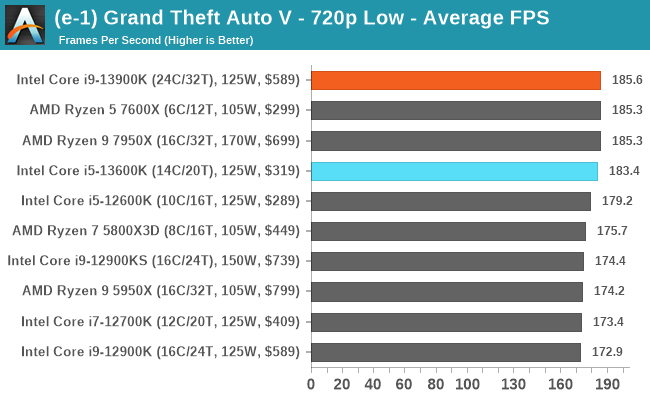
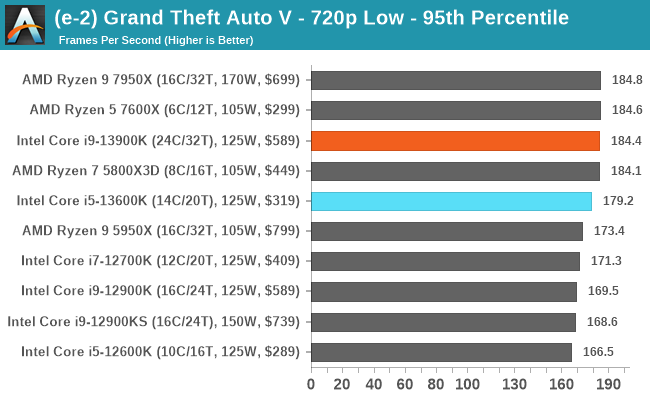
Grand Theft Auto V
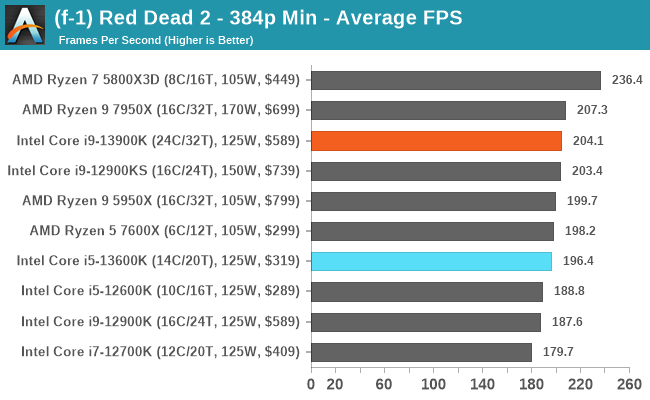
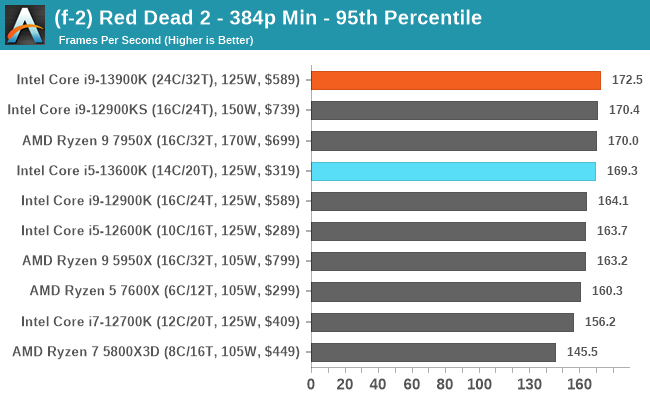
Red Dead Redemption 2
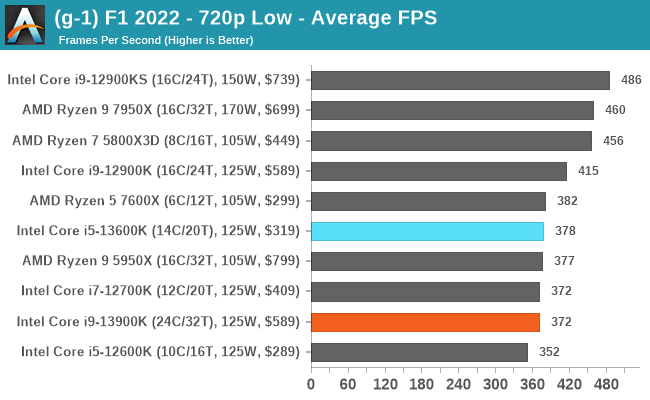
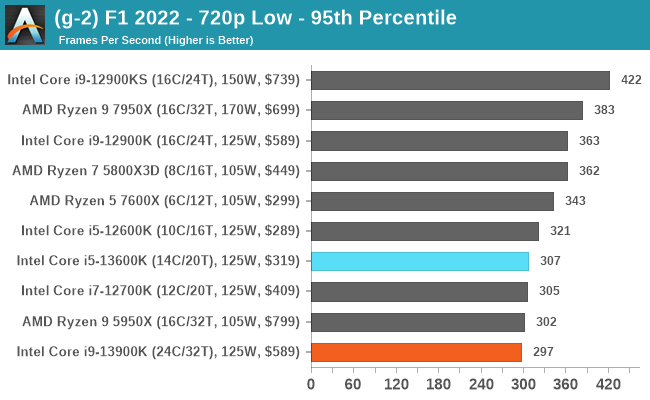
F1 2022
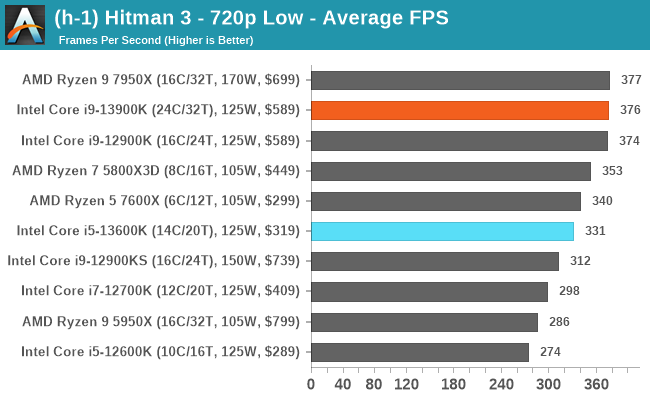
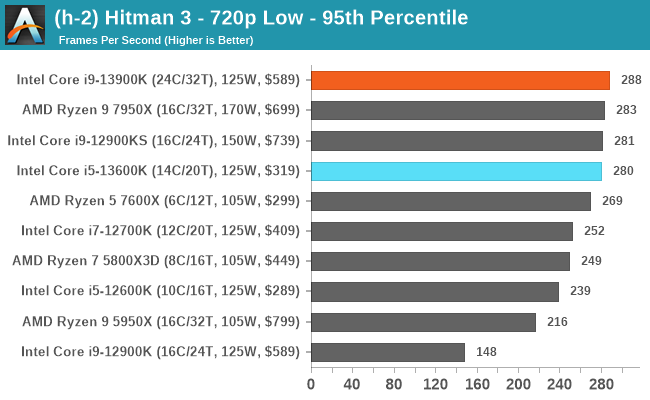
Hitman 3
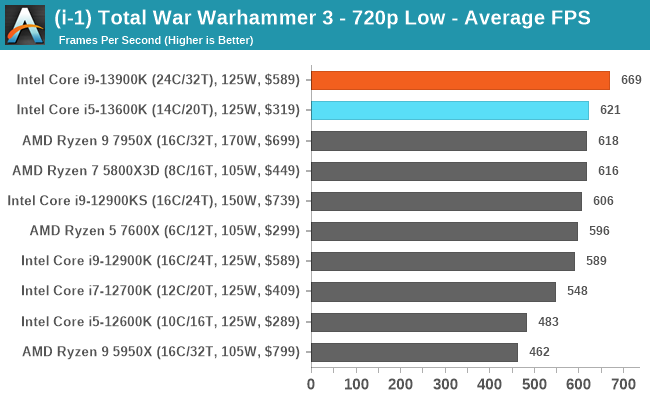
Total War: Warhammer 3
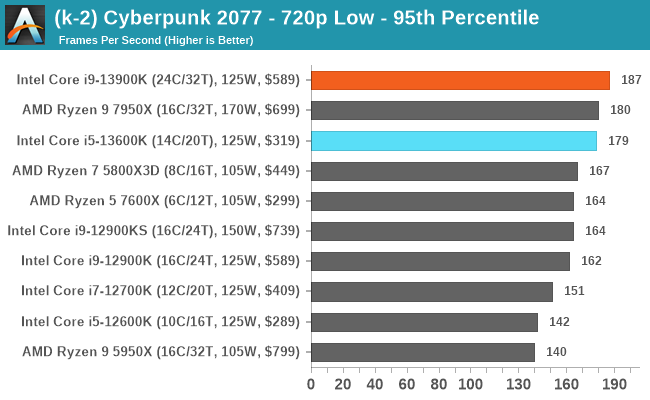
Cyberpunk 2077
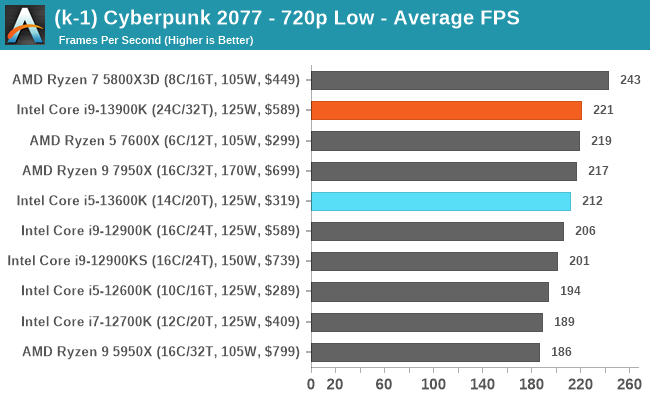
Digesting our results at 720p (and lower) resolutions, we can see that things are quite competitive at the top end, especially with the Core i9-13900K and the Core i9-12900KS across most of the games. Some of the games from our testing look to benefit from a different variable, whether that is core count, quality of cores versus core count and frequency; L3 cache size, or a mixture of all three.
In World of Tanks, the majority of the field of processors on test look to be within a certain margin depending on frequency, IPC, and core count. The Ryzen 9 7950X does well here, although the latest Raptor Lake chips seem to be hovering around the levels of performance as the previous 12th Gen Core chips. In Civ VI, the latest AMD Ryzen 7000 and their Zen 4 cores dominate the field, while the 5800X3D and R9 5950X are also competitive. Behind these come the Intel chips with the Core i9-13900K performing the best of those.
Overall, it's a bit of a mixed bag at 720/480p in terms of performance. There are cases where Raptor Lake performs well, but equally, the same can be said for the Ryzen 7000 chips. But ultimately, none of the top chips here have a 95th percentile frame rate lower than 170fps in any action game, while the more unique Civlization 6 never drops 114fps. Which is to say that these high-end CPUs aren't likely to be a gaming performance bottleneck any time soon – getting a GPU that can keep up at higher resolutions is going to be the harder task.


169 Comments
View All Comments
Pjotr - Thursday, October 20, 2022 - link
Closing thoughts typos: Ryzen 580X3D and Ryzen 700. ReplyRyan Smith - Thursday, October 20, 2022 - link
Thanks! Replymode_13h - Thursday, October 20, 2022 - link
Thanks for the review!Could you please add the aggregates, in the SPEC 2017 scores? There's usually a summary chart that has an average of the individual benchmarks, and then it often has the equivalent scores from more CPUs/configurations than the individual test graphs contain. For example, see the Alder Lake review:
https://www.anandtech.com/show/17047/the-intel-12t... Reply
Arbie - Thursday, October 20, 2022 - link
TechSpot / Hardware Unboxed show that to complete a Blender job the 13900K takes 50% more total system energy than does the 7950X. Intel completing a Cinebench job takes 70% more energy. Meaning heat in the room. And that's with the Intel chip thermal throttling instantly on even the best cooling.Looking at AT's "Power" charts here, which list the Intel chip as "125W" and AMD as "170W", many readers will get EXACTLY THE OPPOSITE impression.
Sure, you mention the difficulties in comparing TDPs etc, and compare this gen Intel to last gen etc but none of that "un-obscures" the totally erroneous Intel vs AMD picture you've conveyed.
ESPECIALLY when your conclusion says they're "very close in performance" !! BAD JOB, AT. The worst I've seen here in a very long time. Incomprehensibly bad. Reply
gezafisch - Thursday, October 20, 2022 - link
Cope harder - watch Der8auer's video showing that the 13900k can beat any chip at efficiency with the right settings - https://youtu.be/H4Bm0Wr6OEQ ReplyRyan Smith - Thursday, October 20, 2022 - link
We go into the subject of power consumption at multiple points and with multiple graphs, including outlining the 13900K's high peak power consumption in the conclusion.https://images.anandtech.com/graphs/graph17601/130...
Otherwise, the only place you see 125W and 170W are in the specification tables. And those values are the official specifications for those chips. Reply
boeush - Thursday, October 20, 2022 - link
Not true. You have those insanely misleading "TDP" labels on every CPU in the legend of every performance comparison chart. This paints a very misleading picture of "competitive" performance, whereas performance at iso-power (e.g. normalized per watt, based on total system power consumption measured at the outlet) would be much more enlightening. Replyboeush - Thursday, October 20, 2022 - link
*per watt-hour (not per watt)[summed over the duration of the benchmark run] Reply
dgingeri - Thursday, October 20, 2022 - link
Is it just me, or does the L1 cache arrangement seem a bit odd? 48k data and 32k instruction for the P cores and 32k data and 64k instruction on the e-cores. Seems a bit odd to me. ReplyOtritus - Thursday, October 20, 2022 - link
Golden/Raptor Cove has a micro-op cache for instructions. 4096 micro-ops is about equal to 16Kb of instruction cache, which is effectively 48Kb-D + 48Kb-I. I don’t remember whether Gracemont has a micro-op cache. However, it doesn’t have hyperthreading, so maybe it just needs less data cache per core. Reply