The Intel 12th Gen Core i9-12900K Review: Hybrid Performance Brings Hybrid Complexity
by Dr. Ian Cutress & Andrei Frumusanu on November 4, 2021 9:00 AM ESTCPU Benchmark Performance: E-Core
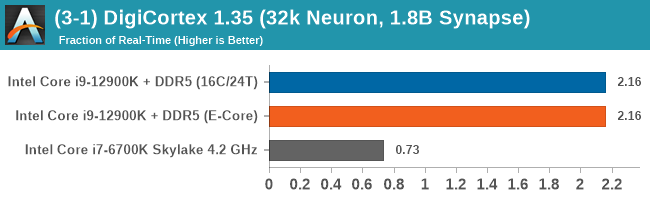
In this batch of testing, we're focusing primarily on the E-cores. Intel claimed that the performance was around the level of its Skylake generation of processors (6th Gen to 10th Gen, depending which slide you read), and we had to put that to the test. In this instance, we're comparing to the flagship Skylake processor, the Core i7-6700K, which offered 4C/8T at 91 W. We also did a number of multi-threaded tests to see where the E-cores would line up.
In order to enable E-core only operation, we used affinity masks.
Single Threaded
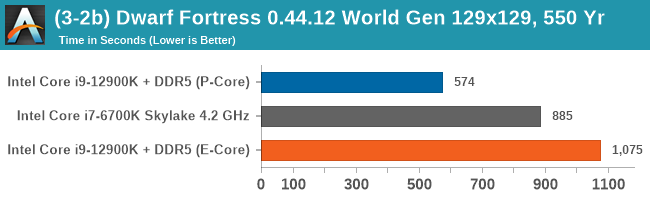
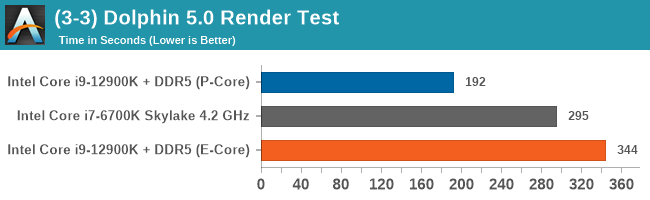
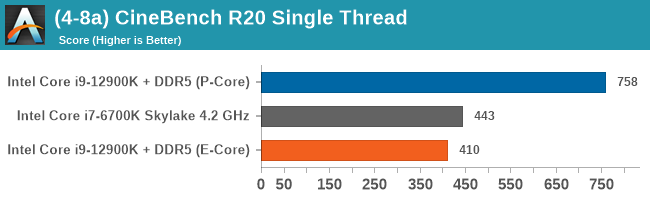
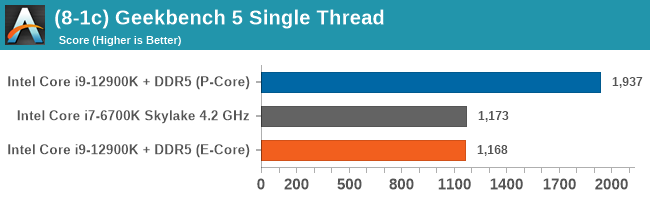
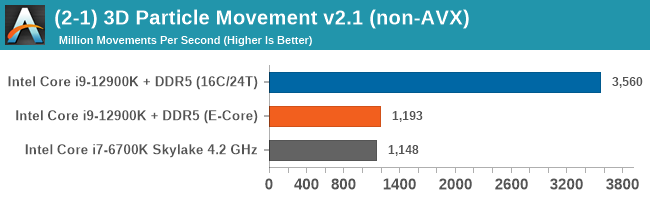
In these few tests, we can see that the E-core is almost there at 4.2 GHz Skylake. Moving down to 3.9 GHz, perhaps something like the i7-6700, would put it on par.
Multi-Thread Tests
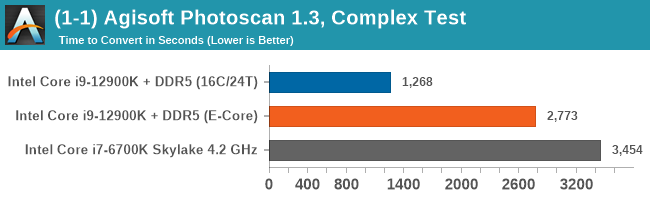
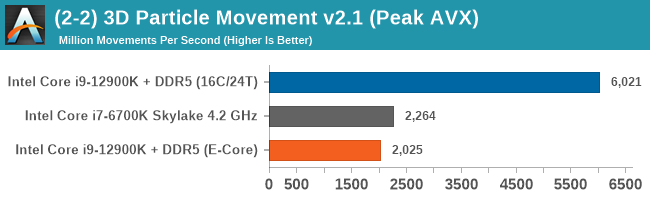
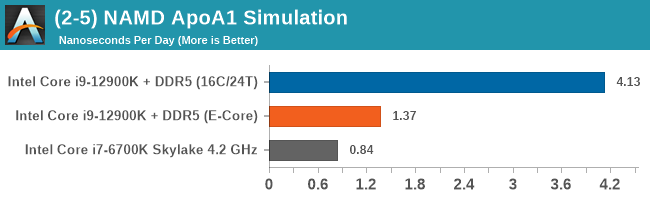
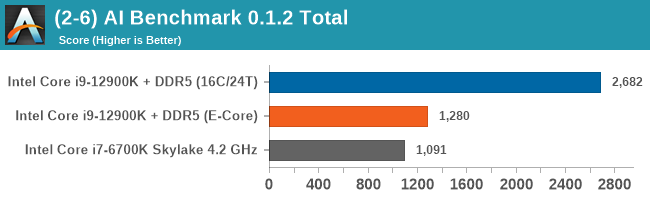
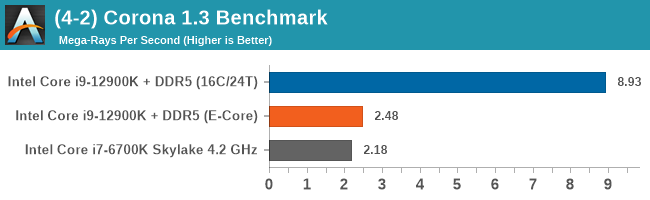
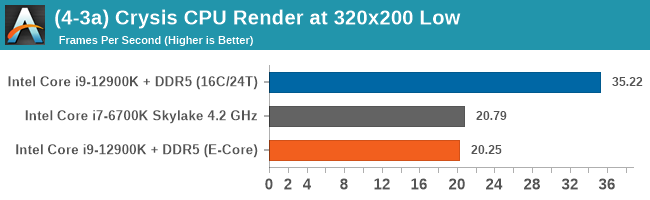
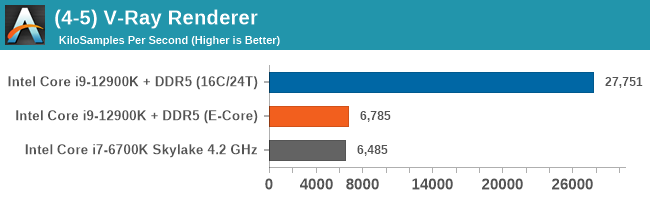
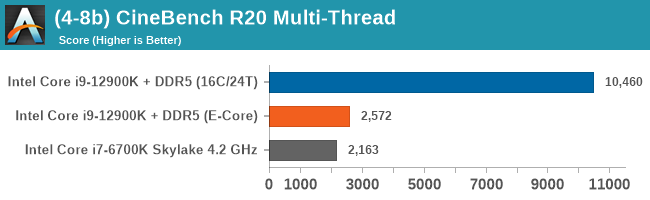
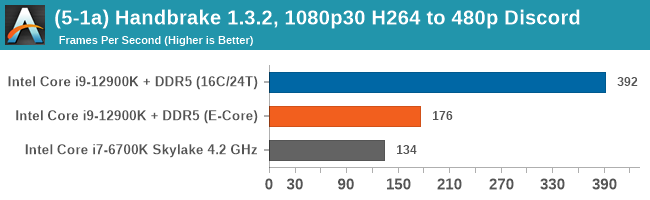
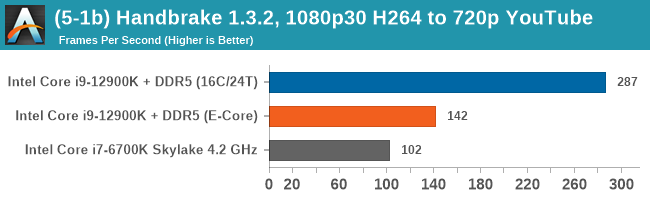
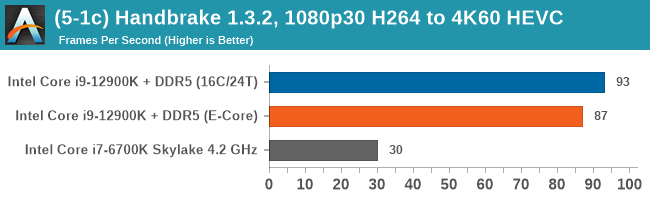
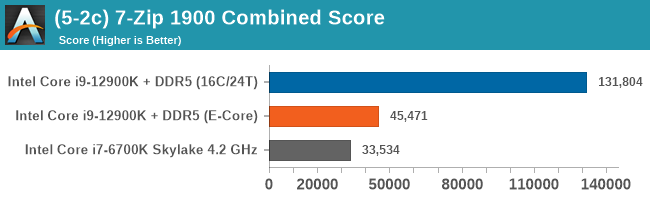
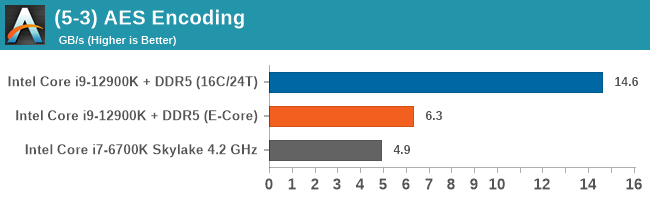
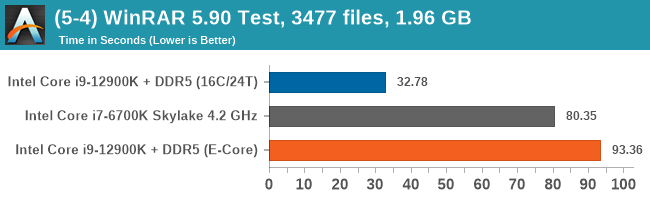
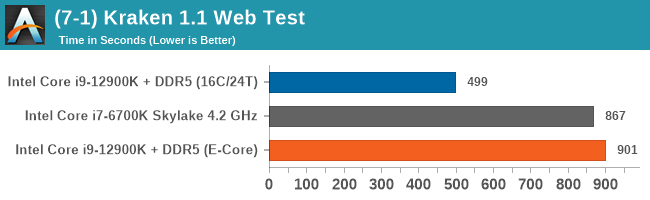
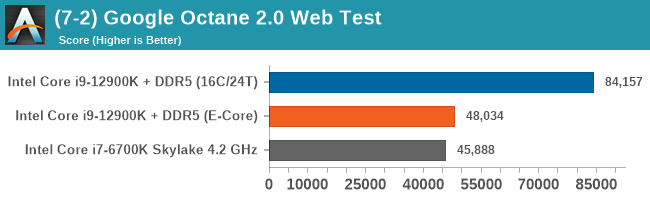
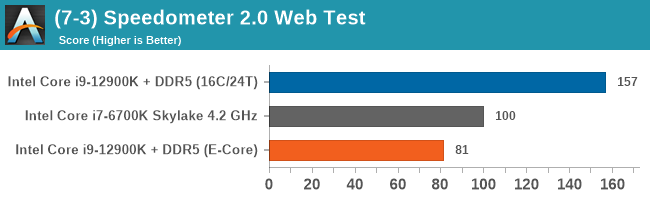
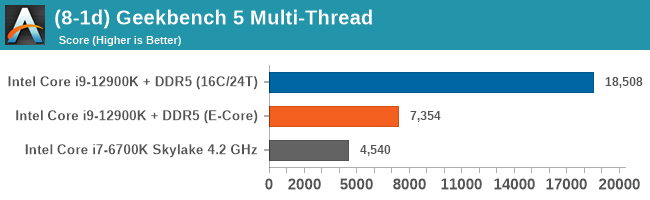
Having a full eight E-cores compared to Skylake's 4C/8T arrangement helps in a lot of scenarios that are compute limited. When we move to more memory limited environments, or with cross-talk, then the E-cores are a bit more limited due to the cache structure and the long core-to-core latencies. Even with DDR5 in tow, the E-cores can be marginal to the Skylake, for example in WinRAR which tends to benefit from cache and memory bandwidth.


474 Comments
View All Comments
Spunjji - Friday, November 5, 2021 - link
N7 is a little more dense than Intel's 10nm-class process - 15-20% in comparable product lines (e.g. Renoir vs. Ice Lake, Lakefield vs. Zen 3 compute chiplet). There is no indication that Intel 7 is more dense than previous iterations of 10nm. N7 also appears to have better power characteristics.It's difficult to tell, though, because Intel are pushing much harder on clock speeds than AMD and have a wider core design, both of which would increase power draw even on an identical process.
Blastdoor - Thursday, November 4, 2021 - link
I’m a little surprised by the low level of attention to performance/watt in this review. ArsTechnica gave a bit more info in that regard, and Alder Lake looks terrible on performance/watt.If Intel had achieved this performance with similar efficiency to AMD I would have bought Intel stock today.
But the efficiency numbers here are truly awful. I can see why this is being released as an enthusiast desktop processor -- that's the market where performance/watt matters least. In the mobile and data center markets (ie, the Big markets), these efficiency numbers are deal breakers. AMD appears to have nothing to fear from Intel in the markets that matter most.
meacupla - Thursday, November 4, 2021 - link
Yeah, the power consumption of 12900K is quite bad.From other reviews, it's pretty clear that highest end air cooling is not enough for 12900K, and you will need a thick 280mm or 360mm water cooler to keep 12900K cool.
Ian Cutress - Thursday, November 4, 2021 - link
I think there are some issues with temperature readings on ADL. A lot of software showcases 100C with only 3 P-cores loaded, but even with all cores loaded, the CPU doesn't de-clock at that temp. My MSI AIO has a temperature display, and it only showed 75C at load. I've got questions out in a few places - I think Intel switched some of the thermal monitoring stuff inside and people are polling the wrong things. Other press are showing 100C quite easily too. I'm asking MSI how their AIO had 75C at load, but I'm still waiting on an answer. An ASUS rep said that 75-80C should be normal under load. So why everything is saying 100C I have no idea.Blastdoor - Thursday, November 4, 2021 - link
Note that the ArsTechnica review looks at power draw from the wall, so unaffected by sensor issues.jamesjones44 - Thursday, November 4, 2021 - link
They also show the 5900x somehow drawing more power than a 5950x at full load. While I'm sure Intel is drawing more power, I question their testing methods given we know there is very little chance of a 5950x fully loaded drawing less than a 5900x unless they won or lost the CPU lottery.TheinsanegamerN - Thursday, November 4, 2021 - link
techspot and TPU also show that, and it has been explained before that the 5950x gets the premium dies and runs at a lower core voltage then the 5900x, thus it pulls less power despite having more cores.haukionkannel - Thursday, November 4, 2021 - link
5950x use better chips than 5900x... that is the reason for power usage!vegemeister - Saturday, November 6, 2021 - link
5950X can hit the current limit when all cores are loaded, so the power consumption folds back.meacupla - Thursday, November 4, 2021 - link
75C reading from the AIO, presumably a reading from the base plate, is quite hot, I must say.