The OnLogic Helix HX500 Review: A Rugged Fanless 35W mini-PC
by Ganesh T S on September 17, 2021 10:00 AM EST- Posted in
- Systems
- Intel
- Fanless
- Industrial PC
- Passive Cooling
- Comet Lake
- OnLogic
Performance Metrics
This section looks at some of the other commonly used benchmarks representative of the performance of specific real-world applications.
Web Browser Benchmarks - JetStream and Speedometer
Web browser-based workloads have emerged as a major component of the typical home and business PC usage scenarios. With the advent of JavaScript-based applications, the ability of a processor to handle web browsing workloads has ramifications well beyond just normal browsing, and on to other business and industrial use-cases also. Hosted at BrowserBench, JetStream 2.0 benchmarks JavaScript and WebAssembly performance, while Speedometer measures web application responsiveness. We also process MotionMark, but the confidence level of the results vary as much as +/-35%. Hence, we present only the Jetstream 2.0 and Speedometer results for the three top browsers below.
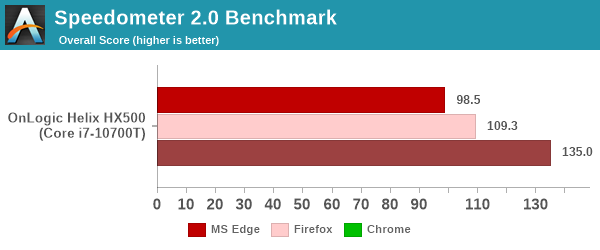
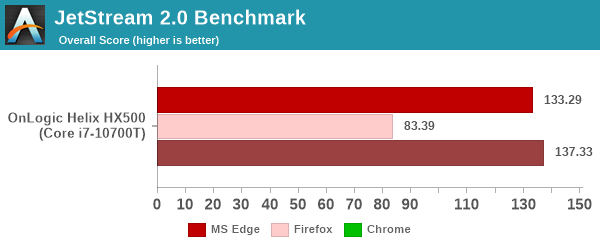
In order to maintain reproducibility, we self-host the BrowserBench benchmarks (git clone of the WebKit repository as on July 1, 2021). The browser versions used for the numbers above are presented in the table included in each system's review. Since this is a new benchmark in the suite, the tables for all systems presented in the graphs above are given below.
| OnLogic Helix HX500 Browser Bench | |||
| Speedometer 2.0 | JetStream 2.0 | MotionMark 1.2 | |
| Microsoft Edge (92.0.902.55) |
98.5 ± 1.1 | 133.286 | 416.35 ± 32.01% |
| Google Chrome (92.0.4515.107) |
135 ± 1.6 | 137.333 | 715.30 ± 2.81% |
| Mozilla Firefox (90.0.2.7872) |
109.3 ± 1.0 | 83.388 | 478.77 ± 31.71% |
BAPCo's SYSmark 25 and UL's PCMark benchmarks both include web browser activitites as part of their evaluation scheme. However, the performance for this increasingly important workload tends to get lost in the presentation of a single number. JetStream and Speedometer help us focus on how different PC configurations vary in terms of the user experience with respect to web browsers.
3D Rendering - CINEBENCH R23
We use CINEBENCH R23 for 3D rendering evaluation. R23 provides two benchmark modes - single threaded and multi-threaded. Evaluation of different PC configurations in both supported modes provided us the following results.
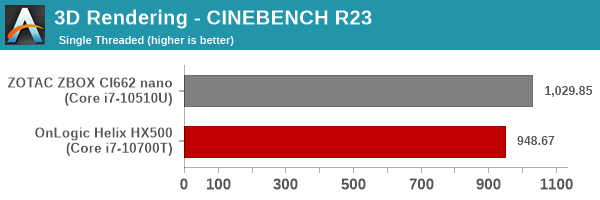
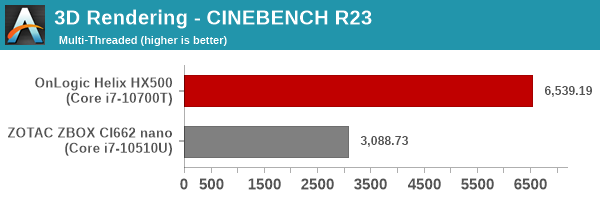
The Core i7-10710U has a higher turbo of 4.7GHz compared to the 4.5 GHz of the Core i7-10700T. This allows the single-threaded performance of the ZBOX CI662 nano to edge out the HX500. However, the two extra cores and higher power budget allow the HX500 to more than double the performance of the ZBOX CI662 nano in the multi-threaded case.
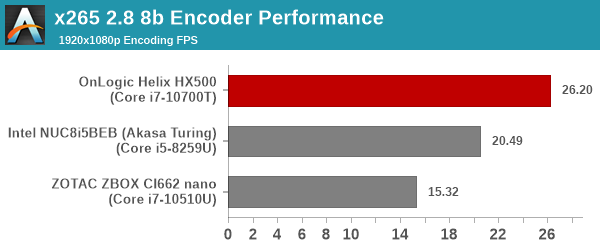
x265 Benchmark
Next up, we have some video encoding benchmarks using x265 v2.8. The appropriate encoder executable is chosen based on the supported CPU features. In the first case, we encode 600 1080p YUV 4:2:0 frames into a 1080p30 HEVC Main-profile compatible video stream at 1 Mbps and record the average number of frames encoded per second.
Our second test case is 1200 4K YUV 4:2:0 frames getting encoded into a 4Kp60 HEVC Main10-profile video stream at 35 Mbps. The encoding FPS is recorded.
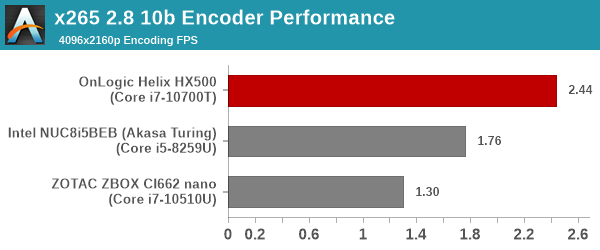
Both of these numbers depend on multi-threaded performance heavily, and it is no surprise that the 8C/16T configuration of the HX500 comes out on top by a huge margin.
7-Zip
7-Zip is a very effective and efficient compression program, often beating out OpenCL accelerated commercial programs in benchmarks even while using just the CPU power. 7-Zip has a benchmarking program that provides tons of details regarding the underlying CPU's efficiency. In this subsection, we are interested in the compression and decompression rates when utilizing all the available threads for the LZMA algorithm.
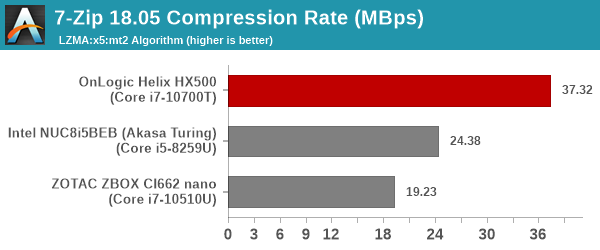
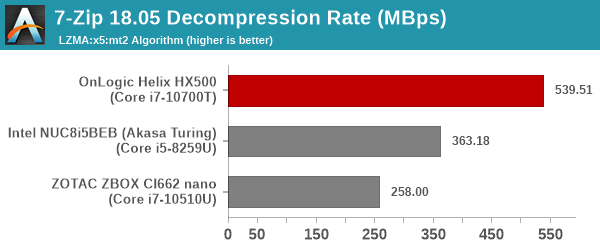
This is again a test of multi-threaded capabilities and the HX500 comes out on top as expected.
Cryptography Benchmarks
Cryptography has become an indispensable part of our interaction with computing systems. Almost all modern systems have some sort of hardware-acceleration for making cryptographic operations faster and more power efficient. In this sub-section, we look at two different real-world applications that may make use of this acceleration.
BitLocker is a Windows features that encrypts entire disk volumes. While drives that offer encryption capabilities are dealt with using that feature, most legacy systems and external drives have to use the host system implementation. Windows has no direct benchmark for BitLocker. However, we cooked up a BitLocker operation sequence to determine the adeptness of the system at handling BitLocker operations. We start off with a 2.5GB RAM drive in which a 2GB VHD (virtual hard disk) is created. This VHD is then mounted, and BitLocker is enabled on the volume. Once the BitLocker encryption process gets done, BitLocker is disabled. This triggers a decryption process. The times taken to complete the encryption and decryption are recorded. This process is repeated 25 times, and the average of the last 20 iterations is graphed below.
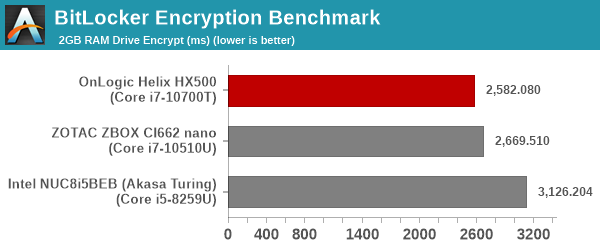
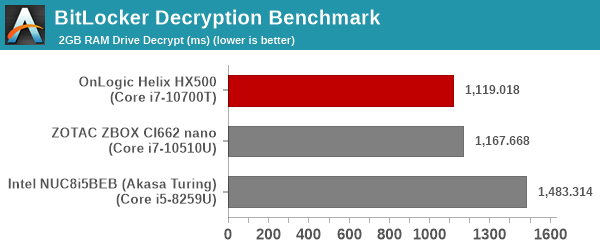
The additional cores and higher power budget ensure that the HX500 has the best numbers in the ecryption / decryption benchmark using BitLocker.
Creation of secure archives is best done through the use of AES-256 as the encryption method while password protecting ZIP files. We re-use the benchmark mode of 7-Zip to determine the AES256-CBC encryption and decryption rates using pure software as well as AES-NI. Note that the 7-Zip benchmark uses a 48KB buffer for this purpose.
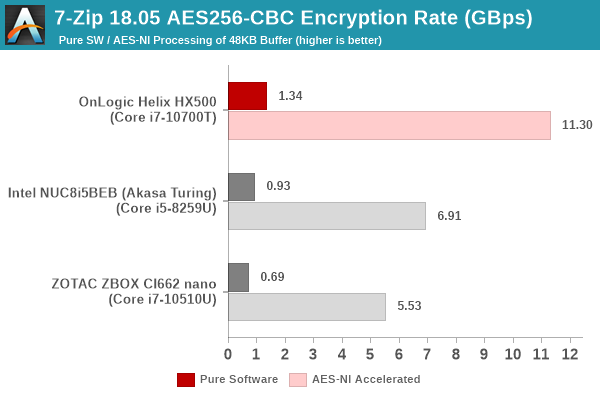
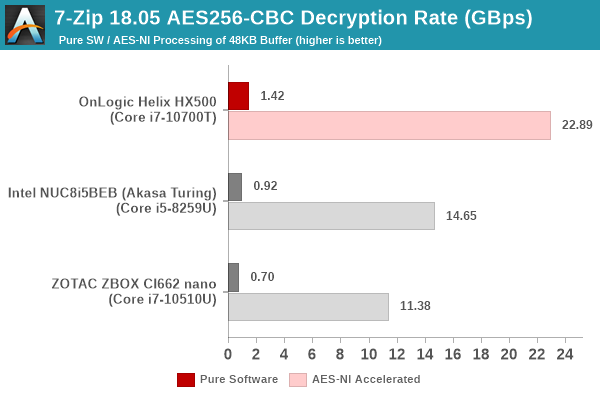
The slight edge for the HX500 in pure software processing is complemented by almost double the relative performance when compared to the other fanless systems we have evaluated before.
Yet another cryptography application is secure network communication. OpenSSL can take advantage of the acceleration provided by the host system to make operations faster. It also has a benchmark mode that can use varying buffer sizes. We recorded the processing rate for a 8KB buffer using the hardware-accelerated AES256-CBC-HAC-SHA1 feature.
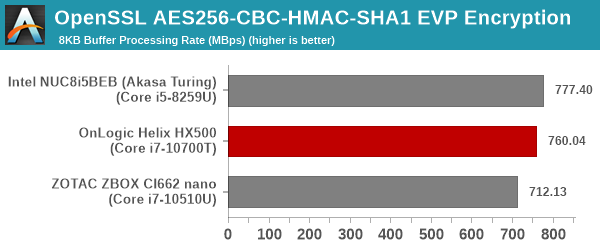
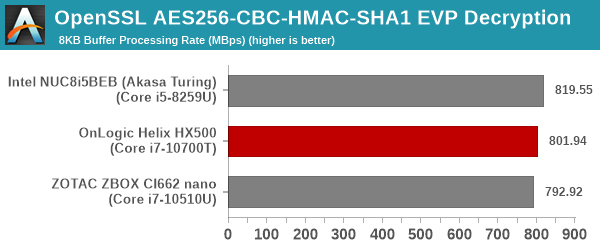
The numbers of OpenSSL are bunched quite close together, unlike the other cryptography benchmarks. The small workload size may not be providing enough fodder for the HX500 to really flex its capabilities.
Agisoft Photoscan
Agisoft PhotoScan is a commercial program that converts 2D images into 3D point maps, meshes and textures. The program designers sent us a command line version in order to evaluate the efficiency of various systems that go under our review scanner. The command line version has two benchmark modes, one using the CPU and the other using both the CPU and GPU (via OpenCL). We present the results from our evaluation using the CPU mode only. The benchmark (v1.3) takes 84 photographs and does four stages of computation:
- Stage 1: Align Photographs (capable of OpenCL acceleration)
- Stage 2: Build Point Cloud (capable of OpenCL acceleration)
- Stage 3: Build Mesh
- Stage 4: Build Textures
We record the time taken for each stage. Since various elements of the software are single threaded, and others multithreaded, it is interesting to record the effects of CPU generations, speeds, number of cores, and DRAM parameters using this software.
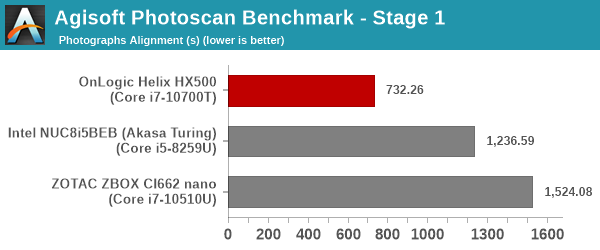
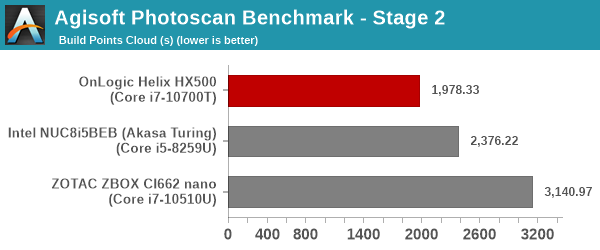
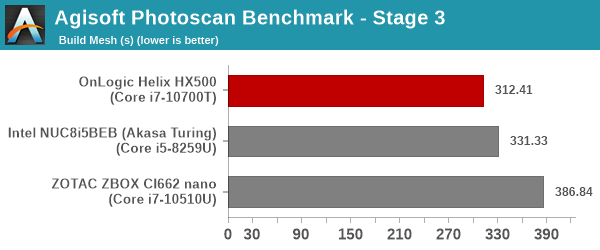
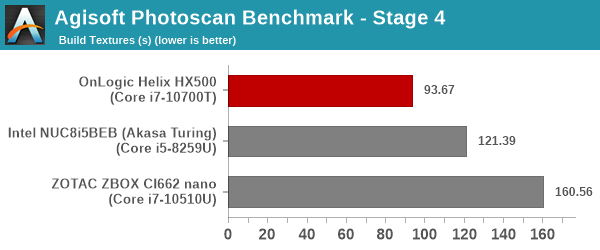
The HX500 comes out as the leader by a huge margin, which is only to be expected given its 8C/16T configuration and 35W TDP, compared to the 4C/8T (28W) and 6C/12T (15W) nature of the other systems in the fray.
Dolphin Emulator
Wrapping up our application benchmark numbers is the new Dolphin Emulator (v5) benchmark mode results. This is again a test of the CPU capabilities.
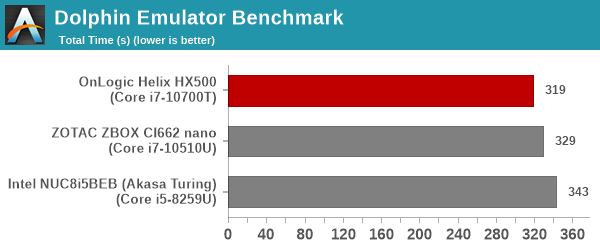
The 35W TDP allows the HX500 to post the best score among the three systems in the comparison list.


32 Comments
View All Comments
Oxford Guy - Friday, September 17, 2021 - link
130W with a 120W adapter.Thermal throttling.
Double failure.
Oxford Guy - Friday, September 17, 2021 - link
138W.Wrs - Saturday, September 18, 2021 - link
No issue there. Adapter is rated for DC output; review measured AC input “at the wall.” 120 into 138w is 87% efficient. We don’t actually know the system was pulling the full 120w DC. The fanless system obviously cannot dissipate that sustained, but settles in the 50-55w range, 60w at the wall. That’s how modern CPUs work. They idle cold, blow past the normal power budget for load and then settle closer to rated power when things warm up.Oxford Guy - Saturday, September 18, 2021 - link
Ok. Thanks for the clarification.So, it's only a single design failure then (thermal throttling).
My view of thermal throttling is that it should only happen as a preventative measure to keep a system from being ruined due to user error (such as letting a machine become clogged with dust).
Otherwise, you're clocking the chip wrong or doing something else wrong with the design. Stuffing 14nm into a passive case in 2021 probably is part of the mistake.
But, for tricking people with numbers I guess hiding the real performance behind a shifting facade of throttling is fun.
Wrs - Sunday, September 19, 2021 - link
So there is normal throttling and then there is emergency throttling or sometimes shutdown. The CPU is rated for 35w, even though the same silicon is known to be capable of 65 or 95w. What they do is as long as all the temperatures are cool, they let the silicon use 60w+ for a few seconds. This can happen in a laptop, or in this industrial enclosure. It makes it feel just as fast as a desktop, but it can’t last for a heavy sustained workload because of heat buildup. After it warms up, it goes back down to the voltage and frequency it was designed to sustain.It has nothing to do with 14nm. My 7nm desktop works similarly. In 2021 Intel’s got 10nm for low-power (that’s what all Tiger Lake laptops are), but OnLogic was too cheap for that or figured their clientele doesn’t want the latest and greatest. Their case successfully prevented the 35w chip from emergency throttling, so it passed the thermal design test in my book.
Oxford Guy - Sunday, September 19, 2021 - link
Marketing magic to try to justify inadequate cooling. Not a fan.Wrs - Monday, September 20, 2021 - link
I mean, it is a fanless, almost sealed enclosure the size of a standing router or cable modem - how much more can you expect? The benchmarks were more than fine. They way outclassed the Zotac, which is also fanless and the size of a router, but uses commodity plastic hole vents which would be wholly inappropriate in industrial settings but would be suitable as a living room htpc. The OnLogic system gets close to 80c peak on the case; one would hope for the sake of longevity that they used high temperature components throughout and that would be the reason for the high price.Potential improvements are obviously a finer process node like Tiger Lake or one of the Zen 3 laptop chips, a low-power specialized fab node... but all that R&D takes time and $$. The world isn't perfect and we don't have infinite population.
Oxford Guy - Tuesday, September 21, 2021 - link
‘how much more can you expect’I expect parts to match the capability of the cooling versus putting too-demanding parts into a box and relying on throttling. If the parts need a larger heatsink box then use that or choose less demanding parts.
The only exception is turbo that is designed to safely ‘overclock’ a chip if the cooling is better than the norm. That is a good feature.
Wrs - Tuesday, September 21, 2021 - link
As far as I can tell the parts match very well. All the CPU choices for the little box top out at 35w. Obviously the 138w momentary draw came from turbo; there is no separate GPU. The review found the junction temperature under sustained load hit 98C which is just under the throttling temp of 100C. A 15w chip would have undersold the capabilities of the design, and a 65w+ desktop part would have been throttled under sustained load unless perhaps operating out of Antarctica…That’s not to say some won’t take issue with the incomplete seal, or that there might be component longevity issues down the road which is where a warranty comes in.
Jonny314159 - Friday, September 17, 2021 - link
Any VRM cooling on this? I think I see a thermal pad for the SSD, but the VRMs will be a long term point of failure running in a sealed box with no conductive path to the heatsink.