AMD EPYC Milan Review Part 2: Testing 8 to 64 Cores in a Production Platform
by Andrei Frumusanu on June 25, 2021 9:30 AM ESTSPECjbb MultiJVM - Java Performance
Moving on from SPECCPU, we shift over to SPECjbb2015. SPECjbb is a from ground-up developed benchmark that aims to cover both Java performance and server-like workloads, from the SPEC website:
“The SPECjbb2015 benchmark is based on the usage model of a worldwide supermarket company with an IT infrastructure that handles a mix of point-of-sale requests, online purchases, and data-mining operations. It exercises Java 7 and higher features, using the latest data formats (XML), communication using compression, and secure messaging.
Performance metrics are provided for both pure throughput and critical throughput under service-level agreements (SLAs), with response times ranging from 10 to 100 milliseconds.”
The important thing to note here is that the workload is of a transactional nature that mostly works on the data-plane, between different Java virtual machines, and thus threads.
We’re using the MultiJVM test method where as all the benchmark components, meaning controller, server and client virtual machines are running on the same physical machine.
The JVM runtime we’re using is OpenJDK 15 on both x86 and Arm platforms, although not exactly the same sub-version, but closest we could get:
EPYC & Xeon systems:
openjdk 15 2020-09-15

OpenJDK Runtime Environment (build 15+36-Ubuntu-1)

OpenJDK 64-Bit Server VM (build 15+36-Ubuntu-1, mixed mode, sharing)
Altra system:
openjdk 15.0.1 2020-10-20

OpenJDK Runtime Environment 20.9 (build 15.0.1+9)

OpenJDK 64-Bit Server VM 20.9 (build 15.0.1+9, mixed mode, sharing)
Furthermore, we’re configuring SPECjbb’s runtime settings with the following configurables:
SPEC_OPTS_C="-Dspecjbb.group.count=$GROUP_COUNT -Dspecjbb.txi.pergroup.count=$TI_JVM_COUNT -Dspecjbb.forkjoin.workers=N -Dspecjbb.forkjoin.workers.Tier1=N -Dspecjbb.forkjoin.workers.Tier2=1 -Dspecjbb.forkjoin.workers.Tier3=16"
Where N=160 for 2S Altra test runs, N=80 for 1S Altra test runs, N=112 for 2S Xeon 8280, N=56 for 1S Xeon 8280, and N=128 for 2S and 1S on the EPYC system. The 75F3 system had the worker count reduced to 64 and 32 for 2S/1S runs, with the 7443, 7343 and 72F3 also having the same thread to core ratiio.
The Xeon 8380 was running at N=140 for 2S Xeon 8380 and N=70 for 1S - the benchmark had been erroring out at higher thread counts.
In terms of JVM options, we’re limiting ourselves to bare-bone options to keep things simple and straightforward:
EPYC & Altra systems:
JAVA_OPTS_C="-server -Xms2g -Xmx2g -Xmn1536m -XX:+UseParallelGC "

JAVA_OPTS_TI="-server -Xms2g -Xmx2g -Xmn1536m -XX:+UseParallelGC"

JAVA_OPTS_BE="-server -Xms48g -Xmx48g -Xmn42g -XX:+UseParallelGC -XX:+AlwaysPreTouch"
Xeon Cascade Lake systems:
JAVA_OPTS_C="-server -Xms2g -Xmx2g -Xmn1536m -XX:+UseParallelGC"

JAVA_OPTS_TI="-server -Xms2g -Xmx2g -Xmn1536m -XX:+UseParallelGC"

JAVA_OPTS_BE="-server -Xms172g -Xmx172g -Xmn156g -XX:+UseParallelGC -XX:+AlwaysPreTouch"
Xeon Ice Lake systems (SNC1):
JAVA_OPTS_C="-server -Xms2g -Xmx2g -Xmn1536m -XX:+UseParallelGC"

JAVA_OPTS_TI="-server -Xms2g -Xmx2g -Xmn1536m -XX:+UseParallelGC"

JAVA_OPTS_BE="-server -Xms192g -Xmx192g -Xmn168g -XX:+UseParallelGC -XX:+AlwaysPreTouch"
Xeon Ice Lake systems (SNC2):
JAVA_OPTS_C="-server -Xms2g -Xmx2g -Xmn1536m -XX:+UseParallelGC"

JAVA_OPTS_TI="-server -Xms2g -Xmx2g -Xmn1536m -XX:+UseParallelGC"

JAVA_OPTS_BE="-server -Xms96g -Xmx96g -Xmn84g -XX:+UseParallelGC -XX:+AlwaysPreTouch"
The reason the Xeon CLX system is running a larger back-end heap is because we’re running a single NUMA node per socket, while for the Altra and EPYC we’re running four NUMA nodes per socket for maximised throughput, meaning for the 2S figures we have 8 backends running for the Altra and EPYC and 2 for the Xeon, and naturally half of those numbers for the 1S benchmarks.
For the Ice Lake system, I ran both SNC1 (one NUMA node) as SNC2 (two nodes), with the corresponding scaling in the back-end memory allocation.
The back-ends and transaction injectors are affinitised to their local NUMA node with numactl –cpunodebind and –membind, while the controller is called with –interleave=all.
The max-jOPS and critical-jOPS result figures are defined as follows:
"The max-jOPS is the last successful injection rate before the first failing injection rate where the reattempt also fails. For example, if during the RT-curve phase the injection rate of 80000 passes, but the next injection rate of 90000 fails on two successive attempts, then the max-jOPS would be 80000."
"The overall critical-jOPS is computed by taking the geomean of the individual critical-jOPS computed at these five SLA points, namely:
• Critical-jOPSoverall = Geo-mean of (critical-jOPS@ 10ms, 25ms, 50ms, 75ms and 100ms response time SLAs)
During the RT curve building phase the Transaction Injector measures the 99th percentile response times at each step level for all the requests (see section 9) that are considered in the metrics computations. It then computes the Critical-jOPS for each of the above five SLA points using the following formula:
(first * nOver + last * nUnder) / (nOver + nUnder) "
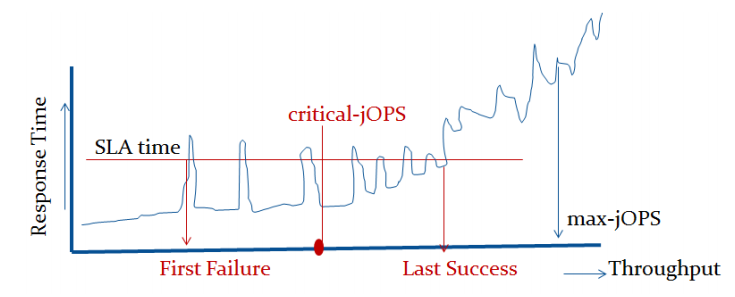
That’s a lot of technicalities to explain an admittedly complex benchmark, but the gist of it is that max-jOPS represents the maximum transaction throughput of a system until further requests fail, and critical-jOPS is an aggregate geomean transaction throughput within several levels of guaranteed response times, essentially different levels of quality of service.
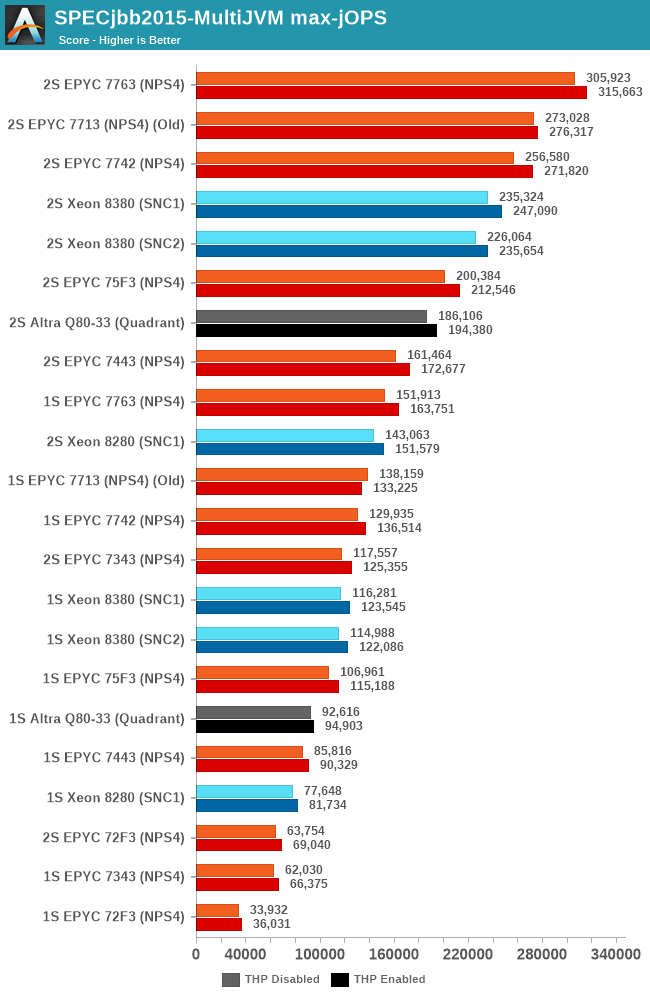
In the max-jOPS metric, the re-tested 7763 increases its throughput by 5%, while the 75F3 oddly enough didn’t see a notable increase.
The 7343 here doesn’t fare quite as well to the Intel competition as in prior tests, AMD’s high core-to-core latency is still a larger bottleneck in such transactional and database-like workloads compared to Intel’s monolithic mesh approach. Only the 7443 manages to have a slight edge over the 28-core Intel SKU.
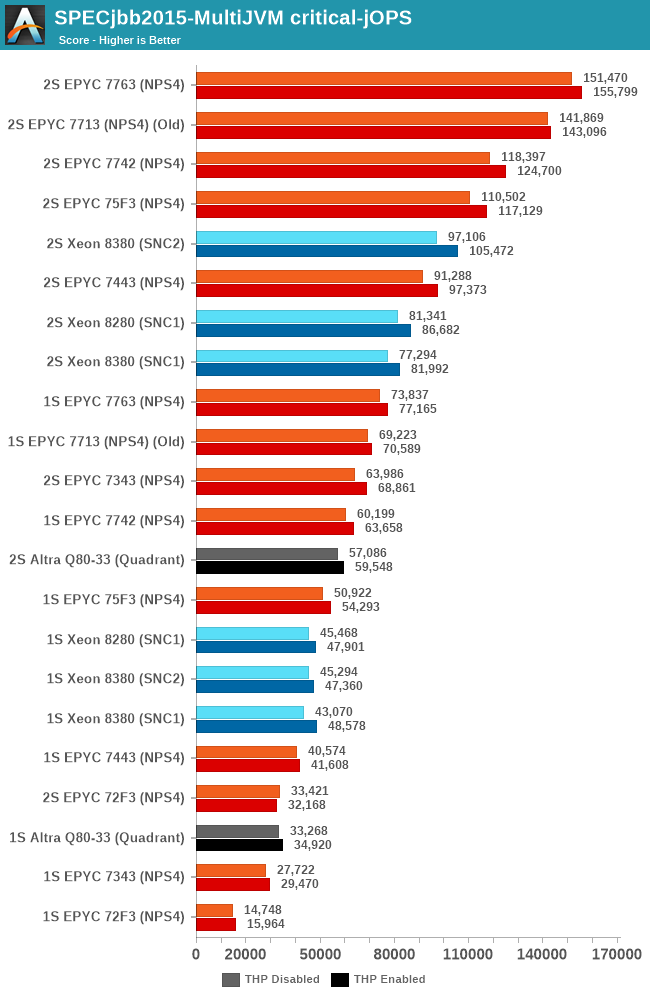
In the critical-jOPS metric, both the 16- and 24-core EPYCs lose out to the 28-core Xeon. Unfortunately we don’t have the Xeon 6330 numbers here due those chips and system being in a different location.


58 Comments
View All Comments
Threska - Sunday, June 27, 2021 - link
Seems the only thing blunted is the economics of throwing more hardware at the problem. Actual technical development has taken off because all the chip-makers have multiple customers across many domains. That's why Anandtech and others are able to have articles like they have.tygrus - Sunday, June 27, 2021 - link
Reminds me of the inn keeper from Les Miserables. Nice to your face with lots of good promises but then tries to squeeze more money out of the customer at every turn.tygrus - Sunday, June 27, 2021 - link
I was ofcourse referring to the SW not the CPU.130rne - Tuesday, September 14, 2021 - link
What the hell did I just read? Just came across this, I had no idea the enterprise side was this fucked. They are scalping the ungodly dog shit out of their own customers. So you obviously can't duplicate their software in house meaning you're forced to use their software to be competitive, that seems to be the gist. So I buy a stronger cpu, usually a newer model, yeah? And it's more power efficient, and I restrict the software to a certain number of threads on those cpus, they'll just switch the pricing model because I have a better processor. This would incentivize me to buy cheaper processors with less threads, yeah? Buy only what I need.130rne - Tuesday, September 14, 2021 - link
Continued- basically gimping my own business, do I have that right? Yes? Ok cool, just making sure.eachus - Thursday, July 15, 2021 - link
There is a compelling use case that builders of military systems will be aware of. If you have an in-memory database and need real-time performance, this is your chip. Real-time doesn't mean really fast, it means that the performance of any command will finish within a specified time. So copy the database on initialization into the L3 cache, and assuming the process is handing the data to another computer for further processing, the data will stay in the cache. (Writes, of course, will go to main memory as well, but that's fine. You shouldn't be doing many writes, and again the time will be predictable--just longer.)I've been retired for over a decade now, so I don't have any knowledge of systems currently being developed.
Who would use a system like this? A good example would be a radar recognition and countermeasures database. The fighter (or other aircraft) needs that data within milliseconds, microseconds is better.
hobbified - Thursday, August 19, 2021 - link
At the time I was involved in that (~2010) it was per-core, with multiple cores on a package counting as "half a CPU" — that is, 1 core = 1CPU license, two 1-core packages = 2CPU license, one 2-core package = 1CPU license, 4 cores total = 2CPU license, etc.I'm told they do things in a completely different (but no less money-hungry) way these days.
lemurbutton - Friday, June 25, 2021 - link
Can we get some metrics on $/performance as well as power/performance? I think the Altra part would be better value there.schujj07 - Friday, June 25, 2021 - link
"Database workloads are admittedly still AMD’s weakness here, but in every other scenario, it’s clear which is the better value proposition." I find this conclusion a bit odd. In MultiJVM max-jOPS the 2S 24c 7443 has ~70% the performance of the 2S 40c 8380 (SNC1 best result) despite having 60% the cores of the 8380. In the critical-jOPS the 7443's performance is between the 8380's SNC1 & SNC2 results despite the core disadvantage. To me that means that the DB performance of the Epyc isn't a weakness.I have personally run the SAP HANA PRD performance test on Epyc 7302's & 7401's. Both CPUs passed the SAP HANA PRD performance test requirements on ESXi 6.7 U3. However, I do not have scores from Intel based hosts for comparison of scores.
schujj07 - Friday, June 25, 2021 - link
The DB conclusion also contradicts what I have read on other sites. https://www.servethehome.com/amd-epyc-7763-review-... Look at the MariaDB numbers for explanation of what is being analyzed. Their 32c Epyc &543p vs Xeon 6314U is also a nice core count vs core count comparison. https://www.servethehome.com/intel-xeon-gold-6314u... In that the Epyc is ~20%+ faster in Maria than the Xeon.