Intel 3rd Gen Xeon Scalable (Ice Lake SP) Review: Generationally Big, Competitively Small
by Andrei Frumusanu on April 6, 2021 11:00 AM EST- Posted in
- Servers
- CPUs
- Intel
- Xeon
- Enterprise
- Xeon Scalable
- Ice Lake-SP
SPEC - Multi-Threaded Performance
Picking up from the power efficiency discussion, let’s dive directly into the multi-threaded SPEC results. As usual, because these are not officially submitted scores to SPEC, we’re labelling the results as “estimates” as per the SPEC rules and license.
We compile the binaries with GCC 10.2 on their respective platforms, with simple -Ofast optimisation flags and relevant architecture and machine tuning flags (-march/-mtune=Neoverse-n1 ; -march/-mtune=skylake-avx512 ; -march/-mtune=znver2 (for Zen3 as well due to GCC 10.2 not having znver3).
The new Ice Lake SP parts are using the -march/-mtune=icelake-server target. It’s to be noted that I briefly tested the system with the Skylake binaries, with little differences within margin of error.
I’m limiting the detailed comparison data to the flagship SKUs, to indicate peak performance of each platform. For that reason it’s not exactly as much an architectural comparison as it’s more of a top SKU comparison.
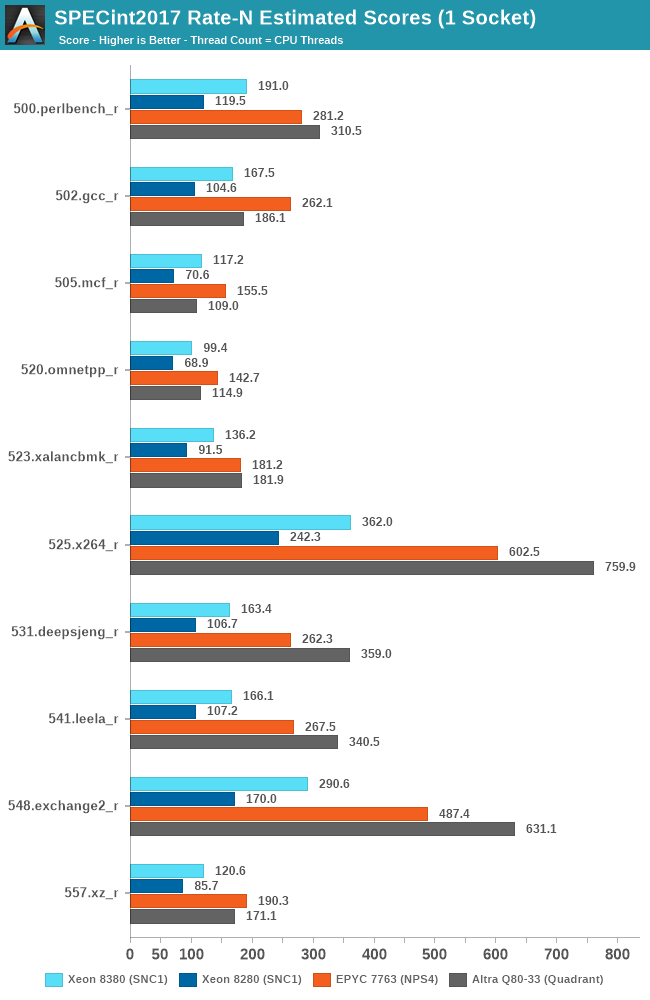
To not large surprise, the Xeon 8380 is posting very impressive performance advancements compared to the Xeon 8280, with large increases across the board for all workloads. The geo-mean increase is +54% with a low of +40% up to a high of +71%.
It’s to be noted that while the new Ice Lake system is a major generational boost, it’s nowhere near enough to catch up with the performance of the AMD Milan or Rome, or Ampere’s Altra when it comes to total throughput.
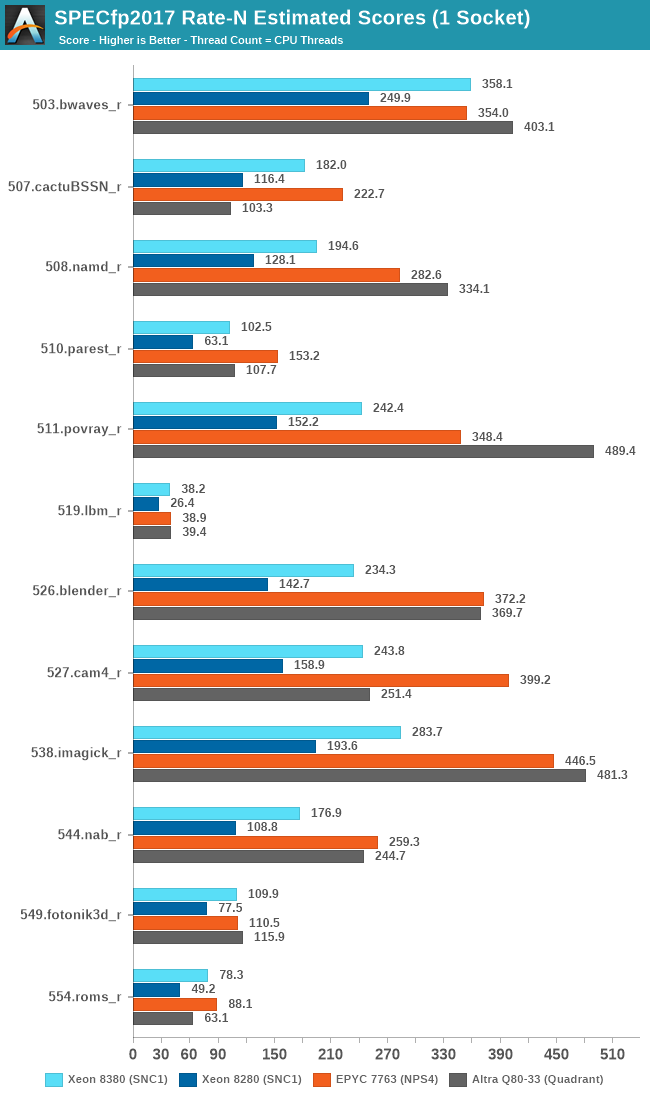
Looking at the FP suite, we have more workloads that are purely memory performance bound, and the Ice Lake Xeon 8380 again is posting significant performance increases compared to its predecessor, with a geo-mean of +53% with a range of +41% to +64%.
In some of the workloads, the new Xeon now catches up and is on par with AMD’s EPYC 7763 due to the fact that both systems have the same memory configuration with 8-channel DDR4-3200.
In any other workloads that requires more CPU compute power, the Xeon doesn’t hold up nearly as well, falling behind the competition by significant margins.
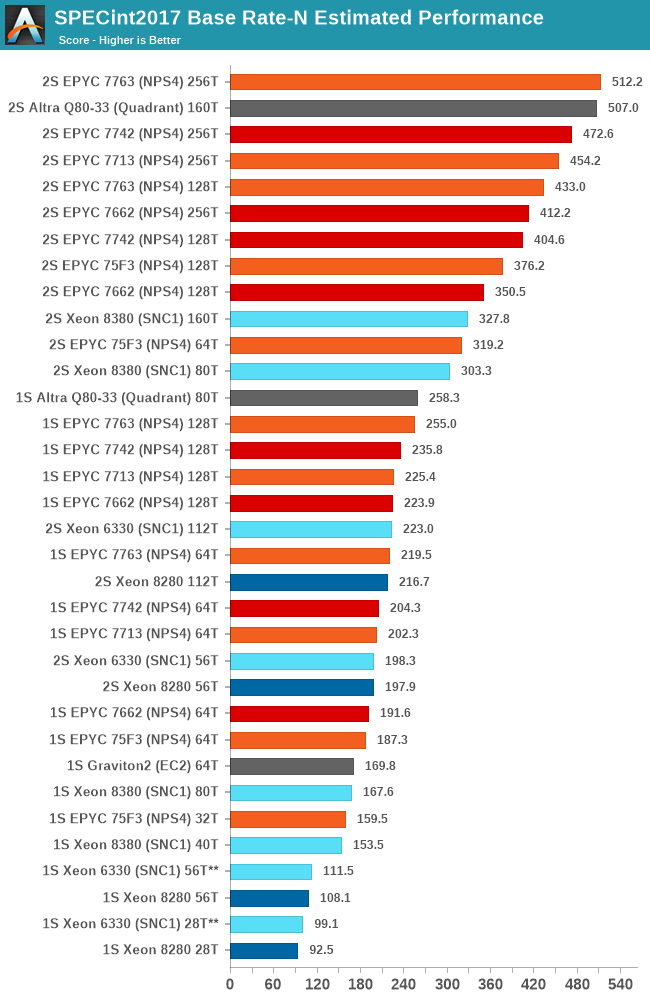
In the aggregate geomean scores, we’re seeing again that the new Xeon 8380 allows Intel to significantly reposition itself in the performance charts. Unfortunately, this is only enough to match the lower core count SKUs from the competition, as AMD and Ampere are still well ahead by massive leads – although admittedly the gap isn’t as embarrassing as it was before.
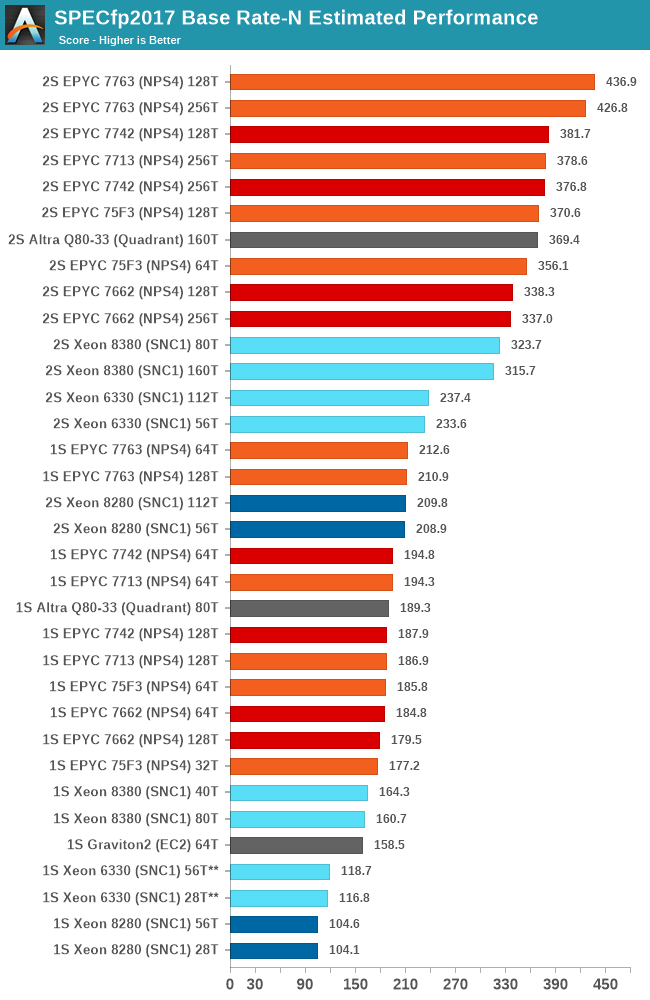
In the floating-point suite, the results are a bit more in favour for the Xeon 8380 compared to the integer suite, as the memory performance is weighed more into the total contribution of the total performance. It’s still not enough to beat the AMD and Ampere parts, but it’s much more competitive than it was before.
The Xeon 6330 is showcasing minor performance improvements over the 8280 and its cheaper equivalent the 6258R, but at least comes at half the cost – so while performance isn’t very impressive, the performance / $ might be more competitive.
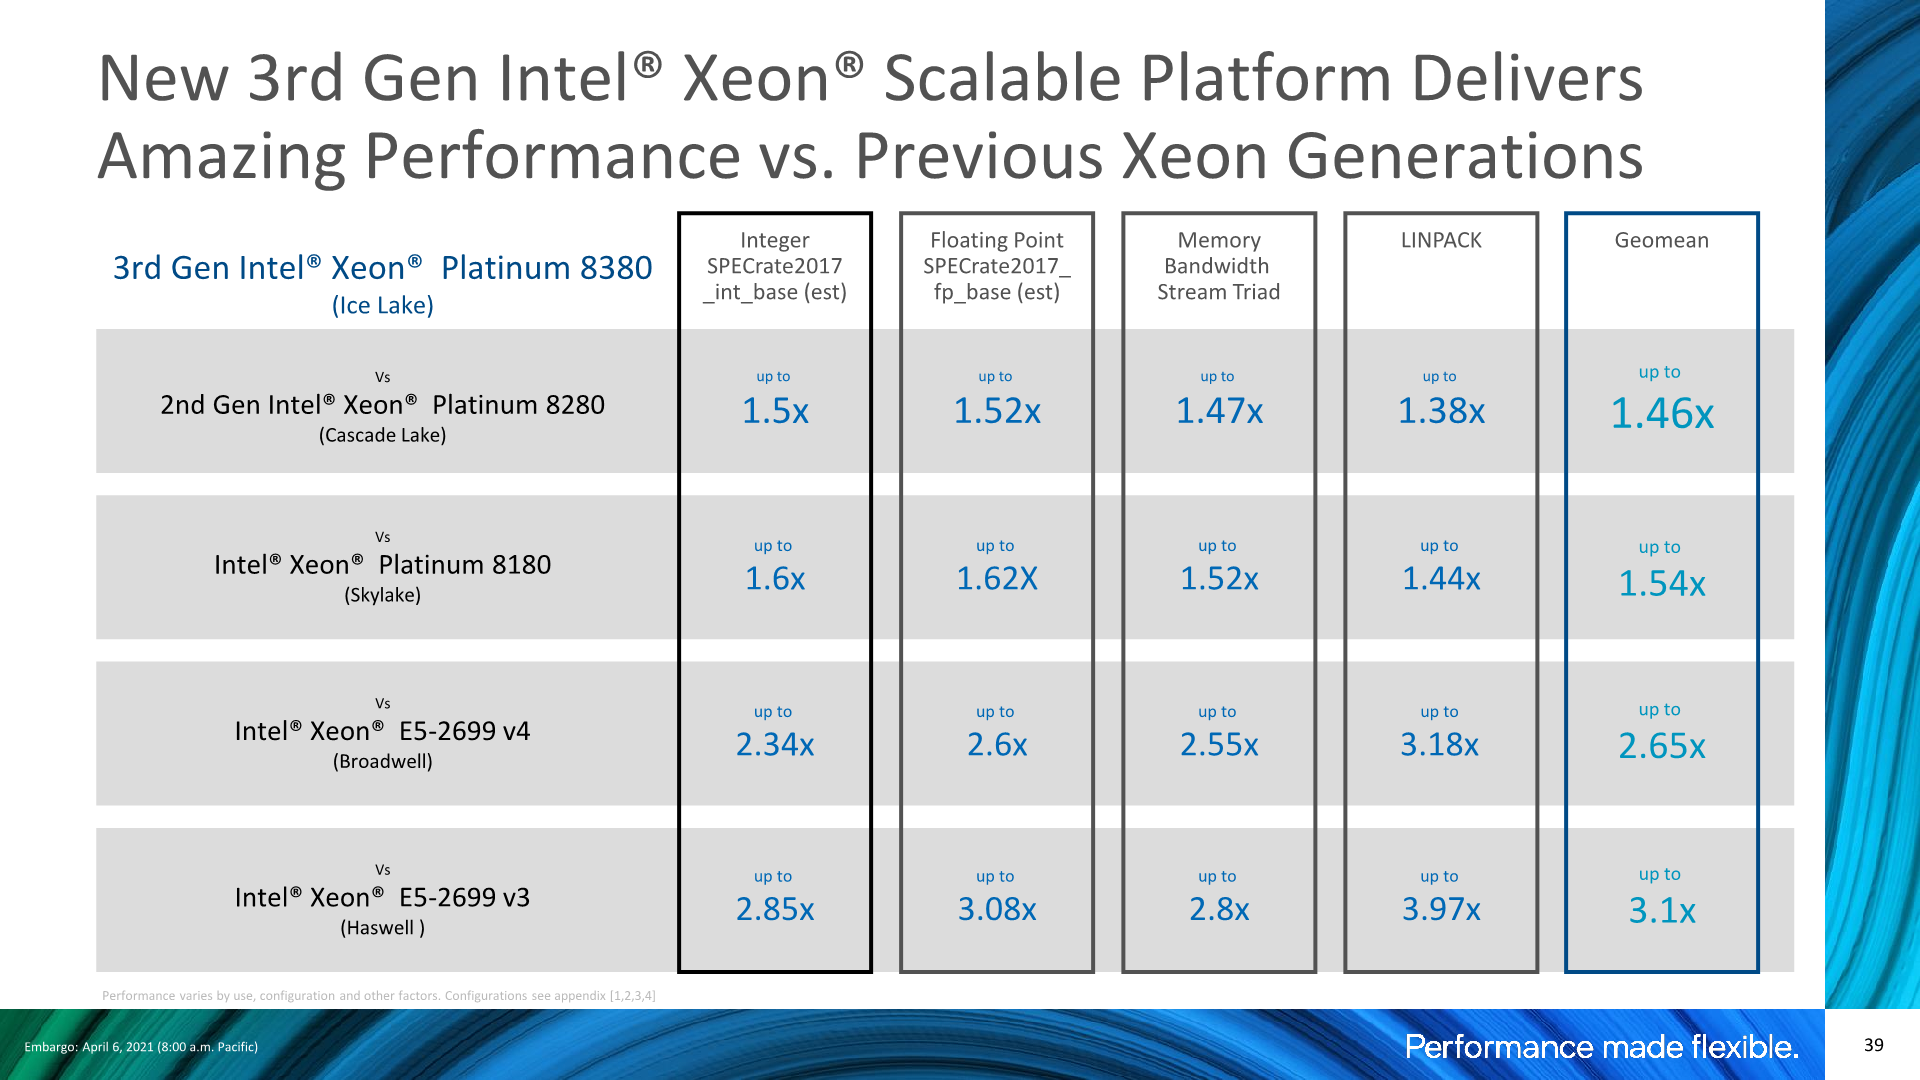
Our performance results match Intel’s own marketing materials when it comes to the generational gains, actually even surpassing Intel’s figures by a few percent.
If you would be looking at Intel’s slide above, you could be extremely enthusiastic about Intel’s new generation, as indeed the performance improvements are extremely large compared to a Cascade Lake system.
As impressive as those generational numbers are, they really only help to somewhat narrow the Grand Canyon sized competitive performance gap we’ve had to date, and the 40-core Xeon 8380 still loses out to a 32-core Milan, and from a performance / price comparison, even a premium 75F3 costs 40% less than the Xeon 8380. Lower SKUs in the Ice Lake line-up would probably fare better in perf/$, however would also just lower the performance to an even worse competitive positioning.


169 Comments
View All Comments
mode_13h - Wednesday, April 7, 2021 - link
Intel, AMD, and ARM all contribute loads of patches to both GCC and LLVM. There's no way either of these compilers can be seen as "underdeveloped".And Intel is usually doing compiler work a couple YEARS ahead of each CPU & GPU generation. If anyone is behind, it's AMD.
Oxford Guy - Wednesday, April 7, 2021 - link
It's not cheating if the CPU can do that work art that speed.It's only cheating if you don't make it clear to readers what kind of benchmark it is (hand-tuned assembly).
mode_13h - Thursday, April 8, 2021 - link
Benchmarks, in articles like this, should strive to be *relevant*. And for that, they ought to focus on representing the performance of the CPUs as the bulk of readers are likely to experience it.So, even if using some vendor-supplied compiler with trick settings might not fit your definition of "cheating", that doesn't mean it's a service to the readers. Maybe save that sort of thing for articles that specifically focus on some aspect of the CPU, rather than the *main* review.
Oxford Guy - Sunday, April 11, 2021 - link
There is nothing more relevant than being able to see all facets of a part's performance. This makes it possible to discern its actual performance capability.Some think all a CPU comparison needs are gaming benchmarks. There is more to look at than subsets of commercial software. Synthetic benchmarks also are valid data points.
mode_13h - Monday, April 12, 2021 - link
It's kind of like whether an automobile reviewer tests a car with racing tyres and 100-octane fuel. That would show you its maximum capabilities, but it's not how most people are going to experience it. While a racing enthusiast might be interested in knowing this, it's not a good proxy for the experience most people are likely to have with it.All I'm proposing is to prioritize accordingly. Yes, we want to know how many lateral g's it can pull on a skid pad, once you remove the limiting factor of the all-season tyres, but that's secondary.
Wilco1 - Thursday, April 8, 2021 - link
It's still cheating if you compare highly tuned benchmark scores with untuned scores. If you use it to trick users into believing CPU A is faster than CPU B eventhough CPU A is really slower, you are basically doing deceptive marketing. Mentioning it in the small print (which nobody reads) does not make it any less cheating.Oxford Guy - Sunday, April 11, 2021 - link
It's cheating to use software that's very unoptimized to claim that that's as much performance as CPU has.For example... let's say we'll just skip all software that has AVX-512 support — on the basis that it's just not worth testing because so many CPUs don't support it.
Wilco1 - Sunday, April 11, 2021 - link
Running not fully optimized software is what we do all the time, so that's exactly what we should be benchmarking. The -Ofast option used here is actually too optimized since most code is built with -O2. Some browsers use -Os/-Oz for much of their code!AVX-512 and software optimized for AVX-512 is quite rare today, and the results are pretty awful on the latest cores: https://www.phoronix.com/scan.php?page=article&...
Btw Andrei ran ICC vs GCC: https://twitter.com/andreif7/status/13808945639975...
ICC is 5% slower than GCC on SPECINT. So there we go.
mode_13h - Monday, April 12, 2021 - link
Not to disagree with you, but always take Phoronix' benchmarks with a grain of salt.First, he tested one 14 nm CPU model that only has one AVX-512 unit per core. Ice Lake has 2, and therefore might've shown more benefit.
Second, PTS is enormous (more than 1 month typical runtime) and I haven't seen Michael being very transparent about his criteria for selecting which benchmarks to feature in his articles. He can easily bias perception through picking benchmarks that respond well or poorly to the feature or product in question.
There are also some questions raised about his methodology, such as whether he effectively controlled for AVX-512 usage in some packages that contain hand-written asm. However, by looking at the power utilization graphs, I doubt that's an issue in this case. But, if he excluded such packages for that very reason, then it could unintentionally bias the results.
Wilco1 - Monday, April 12, 2021 - link
Completely agree that Phoronix benchmarks are dubious - it's not only the selection but also the lack of analysis of odd results and the incorrect way he does cross-ISA comparisons. It's far better to show a few standard benchmarks with well-known characteristics than a random sample of unknown microbenchmarks.Ignoring all that, there are sometimes useful results in all the noise. The power results show that for the selected benchmarks there is really use of AVX-512. Whether this is typical across a wider range of code is indeed the question...