Intel 3rd Gen Xeon Scalable (Ice Lake SP) Review: Generationally Big, Competitively Small
by Andrei Frumusanu on April 6, 2021 11:00 AM EST- Posted in
- Servers
- CPUs
- Intel
- Xeon
- Enterprise
- Xeon Scalable
- Ice Lake-SP
Power & Efficiency - 10nm Gains
Power efficiency in the server world infers performance, as the more efficient a CPU is, the more compute power is available in a given TDP. Ice Lake in this regard is extremely interesting given it’s Intel’s first 10nm server design, and in theory should represent a major leap forward for the new 3rd Gen Xeon line-up.
The comparison here is a bit rough this time around, as we’re dealing with a bit of a apples-and-oranges comparisons between the generational SKUs, particularly the 40-core 270W Xeon 8380 and the 28-core 205W Xeon 8280. Fortunately, we had also been sourced a Xeon 6330 from a third vendor, which is a 28-core 205W Ice Lake SP part, which should make generational comparisons a bit more interesting and fairer, although still not quite optimal as we’ll see.
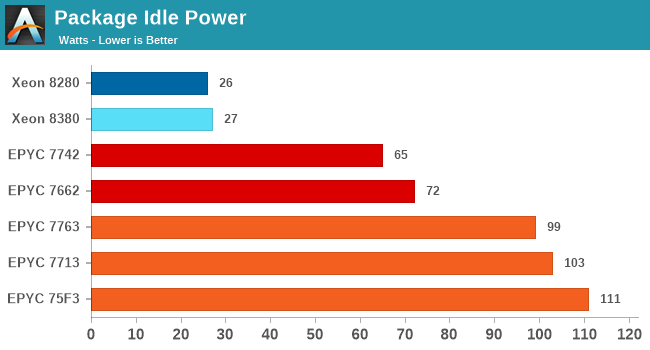
Starting off with idle package power, this was something I had made note of in our coverage of AMD’s Milan CPUs a few weeks ago, where the new AMD chip had regressed in terms of apparent IOD power and eating through the power envelope of the socket resulting in some compute performance regressions.
It’s to be noted that we’re not exactly comparing apples-to-apples here, as AMD’s designs are full SoCs, while the Intel CPUs are merely just CPUs that require the usage of an external chipset (Lewisburg Refresh) which by itself uses about 18W, essentially moving that power requirement off-socket. Intel has multiple versions of the chipset on offer, based on Compression/Encryption offload requirements, up to 28.6 W.
| Ice Lake Xeon Chipsets | ||||
| AnandTech | SKU | Compression Encryption |
RSA | TDP |
| C621A | LBG-1G | None | None | 18.0 W |
| C627A | LBG-T | 65 Gbps / 100 Gbps | 100K OPS | 28.6 W |
| C629A | LGB-C | 80 Gbps / 100 Gbps | None | 28.6 W |
Intel’s new Ice Lake SP system, similarly to the predecessor Cascade Lake SP system, appear to be very efficient at full system idle, reaching only around 27W per socket. It’s to be noted that these figures are only valid when both sockets are idle, if one socket is under load, the second socket’s power consumption will also grow in tandem even though it’s idle, we’ve seen idle figures up to 70W when the other socket is under full load, and even 90W when one socket is boosting frequencies very high. I suspect this is due to voltages and shared power delivery of the 2-socket system. Generally, it’s not of concern in the real world, but it’s just an interesting titbit to make note of.
The more interesting efficiency data is the actual power and energy consumption under load, and the corresponding performance between the generations. Again, we’re in a bit of a difficult situation here as the comparison isn’t as straightforward as the AMD Milan figures from a few weeks ago where we were comparing equal core-count and equal-TDP SKUs.
The new Xeon 8380 flagship Ice Lake SP CPU comes in at a default TDP of 270W, which is 65W higher than its direct predecessor, the 8280, and also features many more cores. Alongside the 270W default setting, I measured this part under a 205W limited power setting to add an extra data-point.
The Xeon 6330 seems a direct match to the Xeon 8280 (which in turn is identical to a Xeon 6258R), however this ICX part comes in at only $1894 versus the $3950 price point of the 6258R, a pricing that might be indicative of the quality of the silicon bin of this SKU, a point I’ll return to in just a bit.
Intel doesn’t make available core-only power metrics on its recent server chips, so we fall back to total package energy measurements only. I add in the total socket energy consumption for the duration of all workloads, as well as the performance and energy measurements on a per-thread basis as we’re dealing with different core-count designs here.
| Ice Lake-SP vs Cascade Lake-SP Power & Energy Efficiency Estimates |
|||||||||||||
| SKU | Xeon 8380 (Ice Lake-SP) |
Xeon 6330 (Ice Lake-SP) |
Xeon 8280 (Cascade Lake-SP) |
||||||||||
| TDP Setting | 270W |
205W (RAPL Limit) |
205W | 205W |
|||||||||
| Threads | 80 | 56 | |||||||||||
| Perf |
PKG (W) |
Perf | PKG (W) |
Perf | PKG (W) |
Perf | PKG (W) |
||||||
| 500.perlbench_r | 190 | 268 | 165 | 204 | 123 | 204 | 119 | 204 | |||||
| 502.gcc_r | 167 | 266 | 152 | 204 | 121 | 204 | 105 | 203 | |||||
| 505.mcf_r | 117 | 263 | 112 | 204 | 92 | 205 | 71 | 201 | |||||
| 520.omnetpp_r | 99 | 264 | 94 | 204 | 71 | 204 | 69 | 204 | |||||
| 523.xalancbmk_r | 136 | 256 | 124 | 204 | 94 | 203 | 91 | 196 | |||||
| 525.x264_r | 362 | 268 | 309 | 204 | 226 | 204 | 242 | 204 | |||||
| 531.deepsjeng_r | 163 | 268 | 140 | 204 | 101 | 204 | 107 | 205 | |||||
| 541.leela_r | 166 | 268 | 146 | 204 | 101 | 205 | 107 | 204 | |||||
| 548.exchange2_r | 290 | 269 | 248 | 204 | 178 | 205 | 170 | 205 | |||||
| 557.xz_r | 120 | 264 | 105 | 204 | 79 | 204 | 86 | 204 | |||||
| SPECint2017 est. | 167.6 | 265 | 149.1 | 204 | 111.5 | 204 | 108.4 | 203 | |||||
| kJ Total | 1937 | 1662 | 1552 | 1612 | |||||||||
| Score / W | 0.632 | 0.731 | 0.546 | 0.534 | |||||||||
| Score per Thread | 2.09 | 1.86 | 1.99 | 1.94 | |||||||||
| kJ per Thread | 24.21 | 20.78 | 27.72 | 28.78 | |||||||||
| 503.bwaves_r | 358 | 247 | 357 | 204 | 324 | 205 | 249 | 188 | |||||
| 507.cactuBSSN_r | 182 | 268 | 163 | 204 | 127 | 204 | 116 | 204 | |||||
| 508.namd_r | 194 | 268 | 164 | 204 | 122 | 204 | 127 | 205 | |||||
| 510.parest_r | 102 | 267 | 99 | 204 | 85 | 204 | 63 | 191 | |||||
| 511.povray_r | 242 | 269 | 203 | 203 | 157 | 204 | 152 | 205 | |||||
| 519.lbm_r | 38 | 236 | 38 | 204 | 34 | 199 | 26 | 173 | |||||
| 526.blender_r | 234 | 268 | 201 | 204 | 153 | 204 | 143 | 204 | |||||
| 527.cam4_r | 244 | 268 | 220 | 204 | 173 | 204 | 161 | 204 | |||||
| 538.imagick_r | 284 | 266 | 249 | 204 | 175 | 204 | 193 | 205 | |||||
| 544.nab_r | 177 | 269 | 151 | 204 | 109 | 204 | 109 | 205 | |||||
| 549.fotonik3d_r | 110 | 244 | 110 | 204 | 99 | 201 | 78 | 154 | |||||
| 554.roms_r | 78 | 261 | 78 | 204 | 68 | 205 | 50 | 173 | |||||
| SPECfp2017 est. | 160.7 | 255 | 147.4 | 204 | 118.7 | 205 | 104.8 | 184 | |||||
| kJ Total | 3877 | 3258 | 2714 | 2958 | |||||||||
| Score / W | 0.631 | 0.722 | 0.546 | 0.570 | |||||||||
| Score per Thread | 2.01 | 1.84 | 2.12 | 1.87 | |||||||||
| kJ per Thread | 48.47 | 40.73 | 48.46 | 52.82 | |||||||||
Starting off with the new flagship CPU, the Xeon 8380 indeed has little trouble to significantly outperform the Xeon 8280 by 54% in both integer and floating-point SPEC suites. This comes as no surprise as the new SKU is also using a higher TDP.
Reducing the Xeon 8380 to 205W, we’re looking at least at a performance comparison at a supposed ISO-power comparison point. Here, the Xeon 8380 again outperforms the 8280 by 40-43%. The actual measured perf/W falls in at +37% for the integer suite and +27% for the FP suite.
As per-thread performance is roughly similar between the two parts here, we can also do an energy per workload comparison, with the Ice Lake SP SKU using -27 to -23% less energy to complete the same task.
Looking at the Xeon 6330 at its default settings, the figures are quite less impressive. At +2.8 and +13.2%, the new design is posting rather lack-lustre performance boosts. The power efficiency and energy consumption figures are also extremely close to that of the 8280.
It’s to be noted, that Intel also has the Xeon 6348 in its line-up which is a 28C part as well, but with a 235W TDP. The results of the 6330 really aren’t too fantastic, even if it’s a weakly binned SKU that comes at a much cheaper price than its predecessor, meaning there’s a possible wide range in silicon quality between the new Ice Lake SKUs, indicating that a badly binned Ice Lake SKU isn’t notably better than a well binned Cascade Lake part.


169 Comments
View All Comments
mode_13h - Wednesday, April 7, 2021 - link
Intel, AMD, and ARM all contribute loads of patches to both GCC and LLVM. There's no way either of these compilers can be seen as "underdeveloped".And Intel is usually doing compiler work a couple YEARS ahead of each CPU & GPU generation. If anyone is behind, it's AMD.
Oxford Guy - Wednesday, April 7, 2021 - link
It's not cheating if the CPU can do that work art that speed.It's only cheating if you don't make it clear to readers what kind of benchmark it is (hand-tuned assembly).
mode_13h - Thursday, April 8, 2021 - link
Benchmarks, in articles like this, should strive to be *relevant*. And for that, they ought to focus on representing the performance of the CPUs as the bulk of readers are likely to experience it.So, even if using some vendor-supplied compiler with trick settings might not fit your definition of "cheating", that doesn't mean it's a service to the readers. Maybe save that sort of thing for articles that specifically focus on some aspect of the CPU, rather than the *main* review.
Oxford Guy - Sunday, April 11, 2021 - link
There is nothing more relevant than being able to see all facets of a part's performance. This makes it possible to discern its actual performance capability.Some think all a CPU comparison needs are gaming benchmarks. There is more to look at than subsets of commercial software. Synthetic benchmarks also are valid data points.
mode_13h - Monday, April 12, 2021 - link
It's kind of like whether an automobile reviewer tests a car with racing tyres and 100-octane fuel. That would show you its maximum capabilities, but it's not how most people are going to experience it. While a racing enthusiast might be interested in knowing this, it's not a good proxy for the experience most people are likely to have with it.All I'm proposing is to prioritize accordingly. Yes, we want to know how many lateral g's it can pull on a skid pad, once you remove the limiting factor of the all-season tyres, but that's secondary.
Wilco1 - Thursday, April 8, 2021 - link
It's still cheating if you compare highly tuned benchmark scores with untuned scores. If you use it to trick users into believing CPU A is faster than CPU B eventhough CPU A is really slower, you are basically doing deceptive marketing. Mentioning it in the small print (which nobody reads) does not make it any less cheating.Oxford Guy - Sunday, April 11, 2021 - link
It's cheating to use software that's very unoptimized to claim that that's as much performance as CPU has.For example... let's say we'll just skip all software that has AVX-512 support — on the basis that it's just not worth testing because so many CPUs don't support it.
Wilco1 - Sunday, April 11, 2021 - link
Running not fully optimized software is what we do all the time, so that's exactly what we should be benchmarking. The -Ofast option used here is actually too optimized since most code is built with -O2. Some browsers use -Os/-Oz for much of their code!AVX-512 and software optimized for AVX-512 is quite rare today, and the results are pretty awful on the latest cores: https://www.phoronix.com/scan.php?page=article&...
Btw Andrei ran ICC vs GCC: https://twitter.com/andreif7/status/13808945639975...
ICC is 5% slower than GCC on SPECINT. So there we go.
mode_13h - Monday, April 12, 2021 - link
Not to disagree with you, but always take Phoronix' benchmarks with a grain of salt.First, he tested one 14 nm CPU model that only has one AVX-512 unit per core. Ice Lake has 2, and therefore might've shown more benefit.
Second, PTS is enormous (more than 1 month typical runtime) and I haven't seen Michael being very transparent about his criteria for selecting which benchmarks to feature in his articles. He can easily bias perception through picking benchmarks that respond well or poorly to the feature or product in question.
There are also some questions raised about his methodology, such as whether he effectively controlled for AVX-512 usage in some packages that contain hand-written asm. However, by looking at the power utilization graphs, I doubt that's an issue in this case. But, if he excluded such packages for that very reason, then it could unintentionally bias the results.
Wilco1 - Monday, April 12, 2021 - link
Completely agree that Phoronix benchmarks are dubious - it's not only the selection but also the lack of analysis of odd results and the incorrect way he does cross-ISA comparisons. It's far better to show a few standard benchmarks with well-known characteristics than a random sample of unknown microbenchmarks.Ignoring all that, there are sometimes useful results in all the noise. The power results show that for the selected benchmarks there is really use of AVX-512. Whether this is typical across a wider range of code is indeed the question...