Intel 3rd Gen Xeon Scalable (Ice Lake SP) Review: Generationally Big, Competitively Small
by Andrei Frumusanu on April 6, 2021 11:00 AM EST- Posted in
- Servers
- CPUs
- Intel
- Xeon
- Enterprise
- Xeon Scalable
- Ice Lake-SP
Power & Efficiency - 10nm Gains
Power efficiency in the server world infers performance, as the more efficient a CPU is, the more compute power is available in a given TDP. Ice Lake in this regard is extremely interesting given it’s Intel’s first 10nm server design, and in theory should represent a major leap forward for the new 3rd Gen Xeon line-up.
The comparison here is a bit rough this time around, as we’re dealing with a bit of a apples-and-oranges comparisons between the generational SKUs, particularly the 40-core 270W Xeon 8380 and the 28-core 205W Xeon 8280. Fortunately, we had also been sourced a Xeon 6330 from a third vendor, which is a 28-core 205W Ice Lake SP part, which should make generational comparisons a bit more interesting and fairer, although still not quite optimal as we’ll see.
Starting off with idle package power, this was something I had made note of in our coverage of AMD’s Milan CPUs a few weeks ago, where the new AMD chip had regressed in terms of apparent IOD power and eating through the power envelope of the socket resulting in some compute performance regressions.
It’s to be noted that we’re not exactly comparing apples-to-apples here, as AMD’s designs are full SoCs, while the Intel CPUs are merely just CPUs that require the usage of an external chipset (Lewisburg Refresh) which by itself uses about 18W, essentially moving that power requirement off-socket. Intel has multiple versions of the chipset on offer, based on Compression/Encryption offload requirements, up to 28.6 W.
| Ice Lake Xeon Chipsets | ||||
| AnandTech | SKU | Compression Encryption |
RSA | TDP |
| C621A | LBG-1G | None | None | 18.0 W |
| C627A | LBG-T | 65 Gbps / 100 Gbps | 100K OPS | 28.6 W |
| C629A | LGB-C | 80 Gbps / 100 Gbps | None | 28.6 W |
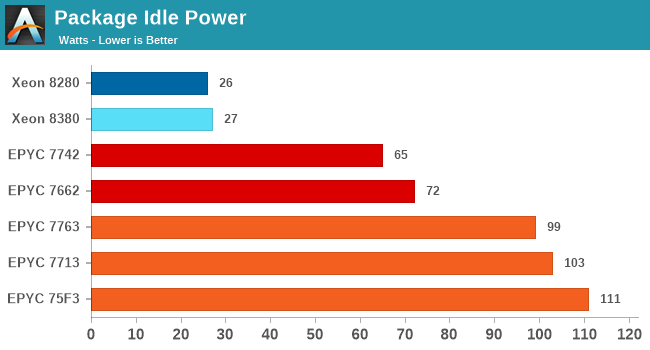
Intel’s new Ice Lake SP system, similarly to the predecessor Cascade Lake SP system, appear to be very efficient at full system idle, reaching only around 27W per socket. It’s to be noted that these figures are only valid when both sockets are idle, if one socket is under load, the second socket’s power consumption will also grow in tandem even though it’s idle, we’ve seen idle figures up to 70W when the other socket is under full load, and even 90W when one socket is boosting frequencies very high. I suspect this is due to voltages and shared power delivery of the 2-socket system. Generally, it’s not of concern in the real world, but it’s just an interesting titbit to make note of.
The more interesting efficiency data is the actual power and energy consumption under load, and the corresponding performance between the generations. Again, we’re in a bit of a difficult situation here as the comparison isn’t as straightforward as the AMD Milan figures from a few weeks ago where we were comparing equal core-count and equal-TDP SKUs.
The new Xeon 8380 flagship Ice Lake SP CPU comes in at a default TDP of 270W, which is 65W higher than its direct predecessor, the 8280, and also features many more cores. Alongside the 270W default setting, I measured this part under a 205W limited power setting to add an extra data-point.
The Xeon 6330 seems a direct match to the Xeon 8280 (which in turn is identical to a Xeon 6258R), however this ICX part comes in at only $1894 versus the $3950 price point of the 6258R, a pricing that might be indicative of the quality of the silicon bin of this SKU, a point I’ll return to in just a bit.
Intel doesn’t make available core-only power metrics on its recent server chips, so we fall back to total package energy measurements only. I add in the total socket energy consumption for the duration of all workloads, as well as the performance and energy measurements on a per-thread basis as we’re dealing with different core-count designs here.
| Ice Lake-SP vs Cascade Lake-SP Power & Energy Efficiency Estimates |
|||||||||||||
| SKU | Xeon 8380 (Ice Lake-SP) |
Xeon 6330 (Ice Lake-SP) |
Xeon 8280 (Cascade Lake-SP) |
||||||||||
| TDP Setting | 270W |
205W (RAPL Limit) |
205W | 205W |
|||||||||
| Threads | 80 | 56 | |||||||||||
| Perf |
PKG (W) |
Perf | PKG (W) |
Perf | PKG (W) |
Perf | PKG (W) |
||||||
| 500.perlbench_r | 190 | 268 | 165 | 204 | 123 | 204 | 119 | 204 | |||||
| 502.gcc_r | 167 | 266 | 152 | 204 | 121 | 204 | 105 | 203 | |||||
| 505.mcf_r | 117 | 263 | 112 | 204 | 92 | 205 | 71 | 201 | |||||
| 520.omnetpp_r | 99 | 264 | 94 | 204 | 71 | 204 | 69 | 204 | |||||
| 523.xalancbmk_r | 136 | 256 | 124 | 204 | 94 | 203 | 91 | 196 | |||||
| 525.x264_r | 362 | 268 | 309 | 204 | 226 | 204 | 242 | 204 | |||||
| 531.deepsjeng_r | 163 | 268 | 140 | 204 | 101 | 204 | 107 | 205 | |||||
| 541.leela_r | 166 | 268 | 146 | 204 | 101 | 205 | 107 | 204 | |||||
| 548.exchange2_r | 290 | 269 | 248 | 204 | 178 | 205 | 170 | 205 | |||||
| 557.xz_r | 120 | 264 | 105 | 204 | 79 | 204 | 86 | 204 | |||||
| SPECint2017 est. | 167.6 | 265 | 149.1 | 204 | 111.5 | 204 | 108.4 | 203 | |||||
| kJ Total | 1937 | 1662 | 1552 | 1612 | |||||||||
| Score / W | 0.632 | 0.731 | 0.546 | 0.534 | |||||||||
| Score per Thread | 2.09 | 1.86 | 1.99 | 1.94 | |||||||||
| kJ per Thread | 24.21 | 20.78 | 27.72 | 28.78 | |||||||||
| 503.bwaves_r | 358 | 247 | 357 | 204 | 324 | 205 | 249 | 188 | |||||
| 507.cactuBSSN_r | 182 | 268 | 163 | 204 | 127 | 204 | 116 | 204 | |||||
| 508.namd_r | 194 | 268 | 164 | 204 | 122 | 204 | 127 | 205 | |||||
| 510.parest_r | 102 | 267 | 99 | 204 | 85 | 204 | 63 | 191 | |||||
| 511.povray_r | 242 | 269 | 203 | 203 | 157 | 204 | 152 | 205 | |||||
| 519.lbm_r | 38 | 236 | 38 | 204 | 34 | 199 | 26 | 173 | |||||
| 526.blender_r | 234 | 268 | 201 | 204 | 153 | 204 | 143 | 204 | |||||
| 527.cam4_r | 244 | 268 | 220 | 204 | 173 | 204 | 161 | 204 | |||||
| 538.imagick_r | 284 | 266 | 249 | 204 | 175 | 204 | 193 | 205 | |||||
| 544.nab_r | 177 | 269 | 151 | 204 | 109 | 204 | 109 | 205 | |||||
| 549.fotonik3d_r | 110 | 244 | 110 | 204 | 99 | 201 | 78 | 154 | |||||
| 554.roms_r | 78 | 261 | 78 | 204 | 68 | 205 | 50 | 173 | |||||
| SPECfp2017 est. | 160.7 | 255 | 147.4 | 204 | 118.7 | 205 | 104.8 | 184 | |||||
| kJ Total | 3877 | 3258 | 2714 | 2958 | |||||||||
| Score / W | 0.631 | 0.722 | 0.546 | 0.570 | |||||||||
| Score per Thread | 2.01 | 1.84 | 2.12 | 1.87 | |||||||||
| kJ per Thread | 48.47 | 40.73 | 48.46 | 52.82 | |||||||||
Starting off with the new flagship CPU, the Xeon 8380 indeed has little trouble to significantly outperform the Xeon 8280 by 54% in both integer and floating-point SPEC suites. This comes as no surprise as the new SKU is also using a higher TDP.
Reducing the Xeon 8380 to 205W, we’re looking at least at a performance comparison at a supposed ISO-power comparison point. Here, the Xeon 8380 again outperforms the 8280 by 40-43%. The actual measured perf/W falls in at +37% for the integer suite and +27% for the FP suite.
As per-thread performance is roughly similar between the two parts here, we can also do an energy per workload comparison, with the Ice Lake SP SKU using -27 to -23% less energy to complete the same task.
Looking at the Xeon 6330 at its default settings, the figures are quite less impressive. At +2.8 and +13.2%, the new design is posting rather lack-lustre performance boosts. The power efficiency and energy consumption figures are also extremely close to that of the 8280.
It’s to be noted, that Intel also has the Xeon 6348 in its line-up which is a 28C part as well, but with a 235W TDP. The results of the 6330 really aren’t too fantastic, even if it’s a weakly binned SKU that comes at a much cheaper price than its predecessor, meaning there’s a possible wide range in silicon quality between the new Ice Lake SKUs, indicating that a badly binned Ice Lake SKU isn’t notably better than a well binned Cascade Lake part.


169 Comments
View All Comments
fallaha56 - Tuesday, April 6, 2021 - link
surebut when your 64-core part virtually beats Intel's dual socket 32-core part on performance alone?
add the energy savings and suddenly it's a 300-400% perf lead
Jorgp2 - Tuesday, April 6, 2021 - link
The fuck?You do realize that they put more than CPUs onto servers right?
Andrei Frumusanu - Tuesday, April 6, 2021 - link
We are testing non-production server configurations, all with varying hardware, PSUs, and other setup differences. Socket comparisons remain relatively static between systems.edzieba - Tuesday, April 6, 2021 - link
Would be interesting to pit the 4309 (or 5315) against the Rocket Lake octacores. Yes, it's a very different platform aimed at a different market, but it would be interesting to see what a hypothetical '10nm Sunny Cove consumer desktop' could have resembled compared to what Rocket Lake's Sunny Cove delivered on 14nm.Jorgp2 - Tuesday, April 6, 2021 - link
You could also compare it to the 10900x, which is an existing AVX-512 CPU with large L2 caches.Holliday75 - Tuesday, April 6, 2021 - link
Typical consumer workloads the RL will be better. For typical server workloads the IL will be better. That is the gist of what would be said.ricebunny - Tuesday, April 6, 2021 - link
These tests are not entirely representative of real world use cases. For open source software, the icc compiler should always be the first choice for Intel chips. The fact that Intel provides such a compiler for free and AMD doesn’t is a perk that you get with owning Intel. It would be foolish not to take advantage of it.Andrei Frumusanu - Tuesday, April 6, 2021 - link
AMD provides AOCC and there's nothing stopping you from running ICC on AMD either. The relative positioning in that scenario doesn't change, and GCC is the industry standard in that regard in the real world.ricebunny - Tuesday, April 6, 2021 - link
Thanks for your reply. I was speaking from my experience in HPC: I’ve never compiled code that I intended to run on Intel architectures with anything but icc, except when the environment did not provide me such liberty, which was rare.If I were to run the benchmarks, I would build them with the most optimal settings for each architecture using their respective optimizing compilers. I would also make sure that I am using optimized libraries, e.g. Intel MKL and not Open BLAS for Intel architecture, etc.
Wilco1 - Tuesday, April 6, 2021 - link
And I could optimize benchmarks using hand crafted optimal inner loops in assembler. It's possible to double the SPEC score that way. By using such optimized code on a slow CPU, it can *appear* to beat a much faster CPU. And what does that prove exactly? How good one is at cheating?If we want to compare different CPUs then the only fair option is to use identical compilers and options like AnandTech does.