Intel 3rd Gen Xeon Scalable (Ice Lake SP) Review: Generationally Big, Competitively Small
by Andrei Frumusanu on April 6, 2021 11:00 AM EST- Posted in
- Servers
- CPUs
- Intel
- Xeon
- Enterprise
- Xeon Scalable
- Ice Lake-SP
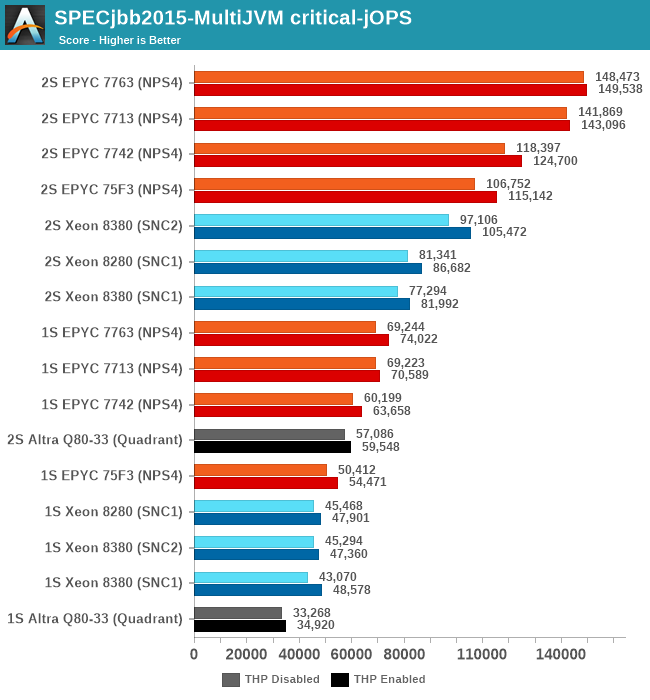
SPECjbb MultiJVM - Java Performance
Moving on from SPECCPU, we shift over to SPECjbb2015. SPECjbb is a from ground-up developed benchmark that aims to cover both Java performance and server-like workloads, from the SPEC website:
“The SPECjbb2015 benchmark is based on the usage model of a worldwide supermarket company with an IT infrastructure that handles a mix of point-of-sale requests, online purchases, and data-mining operations. It exercises Java 7 and higher features, using the latest data formats (XML), communication using compression, and secure messaging.
Performance metrics are provided for both pure throughput and critical throughput under service-level agreements (SLAs), with response times ranging from 10 to 100 milliseconds.”
The important thing to note here is that the workload is of a transactional nature that mostly works on the data-plane, between different Java virtual machines, and thus threads.
We’re using the MultiJVM test method where as all the benchmark components, meaning controller, server and client virtual machines are running on the same physical machine.
The JVM runtime we’re using is OpenJDK 15 on both x86 and Arm platforms, although not exactly the same sub-version, but closest we could get:
EPYC & Xeon systems:
openjdk 15 2020-09-15

OpenJDK Runtime Environment (build 15+36-Ubuntu-1)

OpenJDK 64-Bit Server VM (build 15+36-Ubuntu-1, mixed mode, sharing)
Altra system:
openjdk 15.0.1 2020-10-20

OpenJDK Runtime Environment 20.9 (build 15.0.1+9)

OpenJDK 64-Bit Server VM 20.9 (build 15.0.1+9, mixed mode, sharing)
Furthermore, we’re configuring SPECjbb’s runtime settings with the following configurables:
SPEC_OPTS_C="-Dspecjbb.group.count=$GROUP_COUNT -Dspecjbb.txi.pergroup.count=$TI_JVM_COUNT -Dspecjbb.forkjoin.workers=N -Dspecjbb.forkjoin.workers.Tier1=N -Dspecjbb.forkjoin.workers.Tier2=1 -Dspecjbb.forkjoin.workers.Tier3=16"
Where N=160 for 2S Altra test runs, N=80 for 1S Altra test runs, N=112 for 2S Xeon 8280, N=56 for 1S Xeon 8280, and N=128 for 2S and 1S on the EPYC system. The 75F3 system had the worker count reduced to 64 and 32 for 2S/1S runs.
The Xeon 8380 was running at N=140 for 2S Xeon 8380 and N=70 for 1S - the benchmark had been erroring out at higher thread counts.
In terms of JVM options, we’re limiting ourselves to bare-bone options to keep things simple and straightforward:
EPYC & Altra systems:
JAVA_OPTS_C="-server -Xms2g -Xmx2g -Xmn1536m -XX:+UseParallelGC "

JAVA_OPTS_TI="-server -Xms2g -Xmx2g -Xmn1536m -XX:+UseParallelGC"

JAVA_OPTS_BE="-server -Xms48g -Xmx48g -Xmn42g -XX:+UseParallelGC -XX:+AlwaysPreTouch"
Xeon Cascade Lake systems:
JAVA_OPTS_C="-server -Xms2g -Xmx2g -Xmn1536m -XX:+UseParallelGC"

JAVA_OPTS_TI="-server -Xms2g -Xmx2g -Xmn1536m -XX:+UseParallelGC"

JAVA_OPTS_BE="-server -Xms172g -Xmx172g -Xmn156g -XX:+UseParallelGC -XX:+AlwaysPreTouch"
Xeon Ice Lake systems (SNC1):
JAVA_OPTS_C="-server -Xms2g -Xmx2g -Xmn1536m -XX:+UseParallelGC"

JAVA_OPTS_TI="-server -Xms2g -Xmx2g -Xmn1536m -XX:+UseParallelGC"

JAVA_OPTS_BE="-server -Xms192g -Xmx192g -Xmn168g -XX:+UseParallelGC -XX:+AlwaysPreTouch"
Xeon Ice Lake systems (SNC2):
JAVA_OPTS_C="-server -Xms2g -Xmx2g -Xmn1536m -XX:+UseParallelGC"

JAVA_OPTS_TI="-server -Xms2g -Xmx2g -Xmn1536m -XX:+UseParallelGC"

JAVA_OPTS_BE="-server -Xms96g -Xmx96g -Xmn84g -XX:+UseParallelGC -XX:+AlwaysPreTouch"
The reason the Xeon CLX system is running a larger back-end heap is because we’re running a single NUMA node per socket, while for the Altra and EPYC we’re running four NUMA nodes per socket for maximised throughput, meaning for the 2S figures we have 8 backends running for the Altra and EPYC and 2 for the Xeon, and naturally half of those numbers for the 1S benchmarks.
For the Ice Lake system, I ran both SNC1 (one NUMA node) as SNC2 (two nodes), with the corresponding scaling in the back-end memory allocation.
The back-ends and transaction injectors are affinitised to their local NUMA node with numactl –cpunodebind and –membind, while the controller is called with –interleave=all.
The max-jOPS and critical-jOPS result figures are defined as follows:
"The max-jOPS is the last successful injection rate before the first failing injection rate where the reattempt also fails. For example, if during the RT-curve phase the injection rate of 80000 passes, but the next injection rate of 90000 fails on two successive attempts, then the max-jOPS would be 80000."
"The overall critical-jOPS is computed by taking the geomean of the individual critical-jOPS computed at these five SLA points, namely:
• Critical-jOPSoverall = Geo-mean of (critical-jOPS@ 10ms, 25ms, 50ms, 75ms and 100ms response time SLAs)
During the RT curve building phase the Transaction Injector measures the 99th percentile response times at each step level for all the requests (see section 9) that are considered in the metrics computations. It then computes the Critical-jOPS for each of the above five SLA points using the following formula:
(first * nOver + last * nUnder) / (nOver + nUnder) "
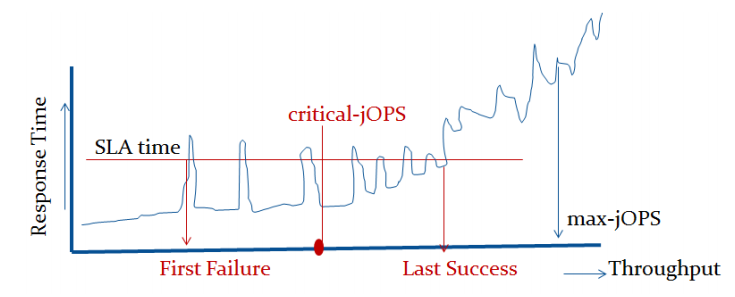
That’s a lot of technicalities to explain an admittedly complex benchmark, but the gist of it is that max-jOPS represents the maximum transaction throughput of a system until further requests fail, and critical-jOPS is an aggregate geomean transaction throughput within several levels of guaranteed response times, essentially different levels of quality of service.
Beyond the result figures, the benchmark keeps detailed track of timings of responses and tracks a few important statistical data-points across a response-time curve, as follows:
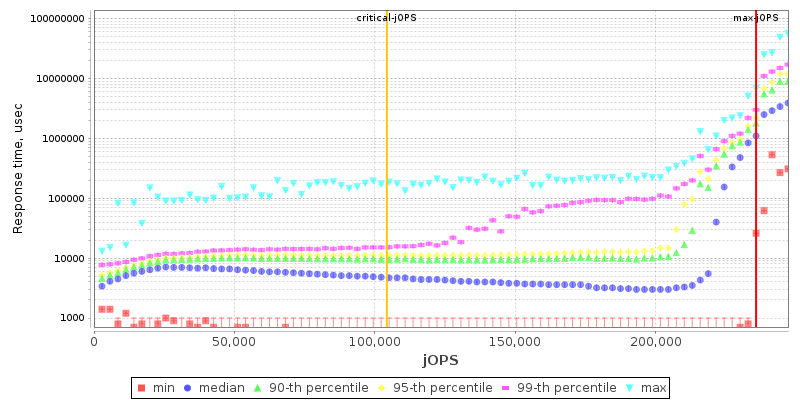
2S Xeon 8380 THP Enabled

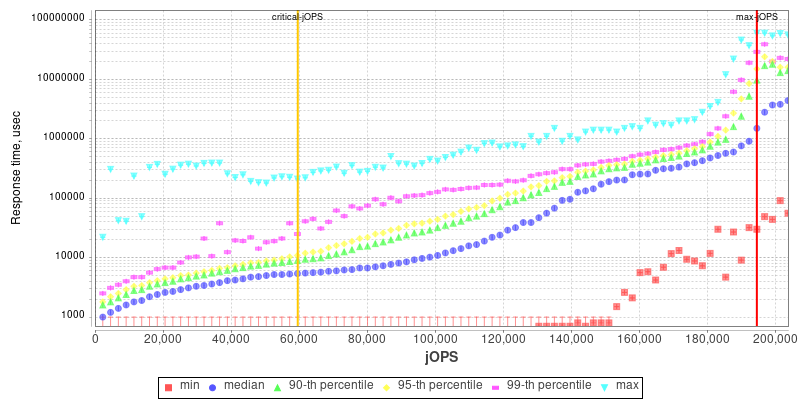
2S Xeon 8280 THP Enabled
Comparing the Xeon 8380 to the Xeon 8280, what’s to be immediately noted is the much-improved maximum throughput figure of the new part, scaling at +64% compared to its predecessor. We’re seeing that the load slope where the 99th percentile SLA figures rises comes in at a relative earlier point, and the corresponding critical-jOPS point lands in relatively earlier than the Xeon 8280.

2S EPYC 7763 THP Enabled
2S Altra Q80-33 THP Enabled
I included the AMD EPYC 7763 and Altra graphs for context.
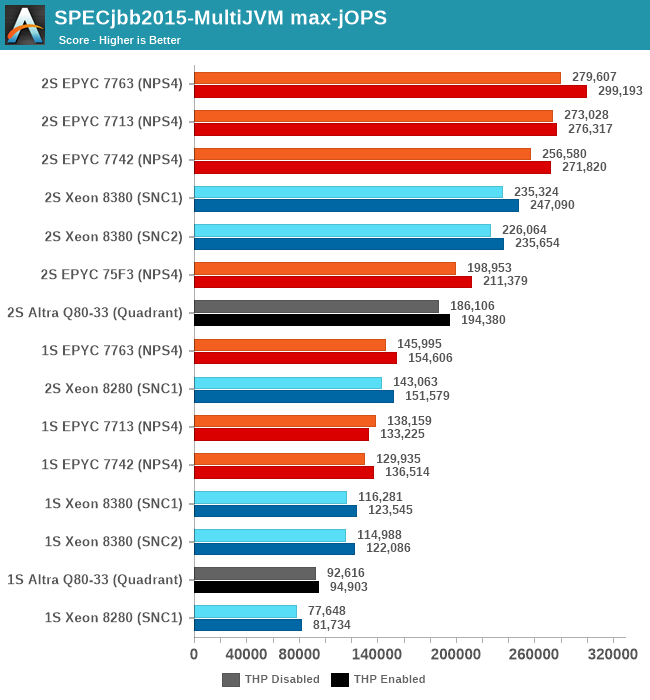
My theory here is that because of the good per-core performance of the Intel design, along with the monolithic mesh architecture, while Intel doesn’t quite catch up with AMD, it performs very well with relatively significantly fewer cores.
What’s really odd about the results though is that this larger increase only happens in the 2S test figures, with the 1S being unfavourable to the new Ice Lake part, losing to the 8280 in both modes. I had repeated these numbers several times to be sure they’re repeatable, and they were indeed so – as odd as that is. The 1S reduction in the critical-jOPS could be explained through the larger mesh size and larger core count of the 8380, and we did see slight regressions in core-to-core latencies. If the mesh intersection bandwidth did not increase with its size, that also could be a culprit of these figures, as the workload is hammering core-to-core transactions as well as the L3 cache of the chip.
Why the 2S figures see a bigger advantage of migrating to SNC2 could be a result of how on-chip traffic is routed, as well as the traffic flows through the UPI link blocks of the chip – at least that would be my working hypothesis.
Intel had disclosed a +62% figure for a “Java Throughput under SLA” workload they wouldn’t specify, and this does track well with our max-jOPS results. While the critical-jOPS increases seem a bit disappointing generationally, how it translates to the real world in contrast to the max-jOPS figure depends on how strict one’s SLA metrics are.


169 Comments
View All Comments
TomWomack - Wednesday, April 7, 2021 - link
Is it known whether there will be an IceLake-X this time round? The list of single-Xeon motherboard launches suggests possibly not; it would obviously be appealing to have a 24-core HEDT without paying the Xeon premium.EthiaW - Wednesday, April 7, 2021 - link
Boeings and Airbuses are never actually sold at their nominal prices, they cost far less, a non-disclosed number, for big buyers after gruesome haggling, sometimes less than half the “catalogue” price.I think this is exactly what's intel doing now: set the catalogue price high to avoid losing face, and give huge discount to avoid losing market share.
duploxxx - Wednesday, April 7, 2021 - link
well easy conclusion.EPYC 75F3 is the clear winner SKU and the must have for most of the workloads.
This is based on price - performance - cores and its related 3rd party sw licensing...
I wonder when Intel will be able to convince VMware to move from a 32core licensing schema to a 40core :)
They used to get all the dev favor when PAT was still in the house, I had several senior engineers in escalation calls stating that the hypervisor was optimised for Intel ...guess what even under optimised looking for a VM farm in 2020-2021-....you are way better off with an AMD build.
WaltC - Wednesday, April 7, 2021 - link
If you can't beat the competition, then what? Ian seems to be impressed that Intel was finally able to launch a Xeon that's a little faster than its previous Xeon, but not fast enough to justify the price tag in relation to what AMD has been offering for a while. So here we are congratulating Intel on burning through wads more cash to produce yet-another-non-competitive result. It really seems as if Intel *requires* AMD to set its goals and to tell it where it needs to go--and that is sad. It all began with x86-64 and SDRAM from AMD beating out Itanium and RDRAM years ago. And when you look at what Intel has done since it's just not all that impressive. Well, at least we can dispense with the notion that "Intel's 10nm is TSMC's 7nm" as that clearly is not the case.JayNor - Wednesday, April 7, 2021 - link
What about the networking applications of this new chip? Dan Rodriguez's presentation showed gains of 1.4x to 1.8x for various networking benchmarks. Intel's entry into 5G infrastructure, NFV, vRAN, ORAN, hybrid cloud is growing faster than they originally predicted. They are able to bundle Optane, SmartNICs, FPGAs, eASIC chips, XeonD, P5900 family Atom chips... I don't believe they have a competitor that can provide that level of solution.Bagheera - Thursday, April 8, 2021 - link
Patr!ck Patr!ck Partr!ck?evilpaul666 - Saturday, April 10, 2021 - link
It only works in front of a mirror. Donning a hoodie helps, too.Oxford Guy - Wednesday, April 7, 2021 - link
There is some faulty logic at work in many of the comments, with claims like it's cheating to use a more optimized compiler.It's not cheating unless:
• the compiler produces code that's so much more unstable/buggy that it's quite a bit more untrustworthy than the less-optimized compiler
• you don't make it clear to readers that the compiler may make the architecture look more performant simply because the other architectures may not have had compiler optimizations on the same level
• you use the same compiler for different architectures when using a different compiler for one or more other architectures will produce more optimized code for those architectures as well
• the compiler sabotages the competition, via things like 'genuine Intel'
Fact is that if a CPU can accomplish a certain amount of work in a certain amount of time, using a certain amount of watts under a certain level of cooling — that is the part's actual performance capability.
If that means writing machine code directly (not even assembly) to get to that performance level, so what? That's an entirely different matter, which is how practical/economical/profitable/effortful it is to get enough code to measure all of the different aspects of the part's maximum performance capability. The only time one can really cite that as a deal-breaker is if one has hard data to demonstrate that by the time the hand-tuned/optimized code is written changes to the architecture (and/or support chips/hardware) will obsolete the advantage — making the effort utterly fruitless, beyond intellectual curiosity concerning the part's ability. For instance, if one knows that Intel, for instance, is going to integrate new instructions (very soon) that will make various types of hand-tuned assembly obsolete in short order, it can be argued that it's not worth the effort to write the code. People made this argument with some of AMD's Bulldozer/Piledriver instructions, on the basis that enough industry adoption wasn't going to happen. But, frankly... if you're going to make claims about the part's performance, you really should do what you can to find out what it is.
Oxford Guy - Wednesday, April 7, 2021 - link
One can, though, of course... include a disclaimer that 'it seems clear enough that, regardless of how much hand-tuned code is done, the CPU isn't going to deliver enough to beat the competition, if the competition's code is similarly hand-tuned' — if that's the case. Even if a certain task is tuned to run twice as fast, is it going to be twice as fast as tuned code for the competition's stuff? Is its performance per watt deficit going to be erased? Will its pricing no longer be a drag on its perceived competitiveness?For example, one could have wrung every last drop of performance out of Bulldozer but it wasn't going to beat Sandy Bridge E — a chip with the same number of transistors. Piledriver could beat at least the desktop version of Sandy in certain workloads when clocked well outside of the optimal (for the node's performance per watt) range but that's where it's very helpful to have tests at the same clock. It was discovered, for instance, that the Fury X and Vega had basically identical performance at the same clock. Since desktop Sandy could easily clock at the same 4.0 GHz Piledriver initially shipped with it could be tested at that rate, too.
Ideally, CPU makers would release benchmarks that demonstrate every facet of their chip's maximum performance. The concern about those being best-case and synthetic is less of a problem in that scenario because all aspects of the chip's performance would be tested and published. That makes cherry-picking impossible.
mode_13h - Thursday, April 8, 2021 - link
The faulty logic I see is that you seem to believe it's the review's job to showcase the product in the best possible light. No, that's Intel's job, and you can find plenty of that material at intel.com, if that's what you want.Articles like this should focus on representing the performance of the CPUs as the bulk of readers are likely to experience it. So, even if using some vendor-supplied compiler with trick settings might not fit your definition of "cheating", that doesn't mean it's a service to the readers.
I think it could be appropriate to do that sort of thing, in articles that specifically analyze some narrow aspect of a CPU, for instance to determine the hardware's true capabilities or if it was just over-hyped. But, not in these sort of overall reviews.