Intel Core i7-11700K Review: Blasting Off with Rocket Lake
by Dr. Ian Cutress on March 5, 2021 4:30 PM EST- Posted in
- CPUs
- Intel
- 14nm
- Xe-LP
- Rocket Lake
- Cypress Cove
- i7-11700K
CPU Tests: Encoding
One of the interesting elements on modern processors is encoding performance. This covers two main areas: encryption/decryption for secure data transfer, and video transcoding from one video format to another.
In the encrypt/decrypt scenario, how data is transferred and by what mechanism is pertinent to on-the-fly encryption of sensitive data - a process by which more modern devices are leaning to for software security.
Video transcoding as a tool to adjust the quality, file size and resolution of a video file has boomed in recent years, such as providing the optimum video for devices before consumption, or for game streamers who are wanting to upload the output from their video camera in real-time. As we move into live 3D video, this task will only get more strenuous, and it turns out that the performance of certain algorithms is a function of the input/output of the content.
HandBrake 1.32: Link
Video transcoding (both encode and decode) is a hot topic in performance metrics as more and more content is being created. First consideration is the standard in which the video is encoded, which can be lossless or lossy, trade performance for file-size, trade quality for file-size, or all of the above can increase encoding rates to help accelerate decoding rates. Alongside Google's favorite codecs, VP9 and AV1, there are others that are prominent: H264, the older codec, is practically everywhere and is designed to be optimized for 1080p video, and HEVC (or H.265) that is aimed to provide the same quality as H264 but at a lower file-size (or better quality for the same size). HEVC is important as 4K is streamed over the air, meaning less bits need to be transferred for the same quality content. There are other codecs coming to market designed for specific use cases all the time.
Handbrake is a favored tool for transcoding, with the later versions using copious amounts of newer APIs to take advantage of co-processors, like GPUs. It is available on Windows via an interface or can be accessed through the command-line, with the latter making our testing easier, with a redirection operator for the console output.
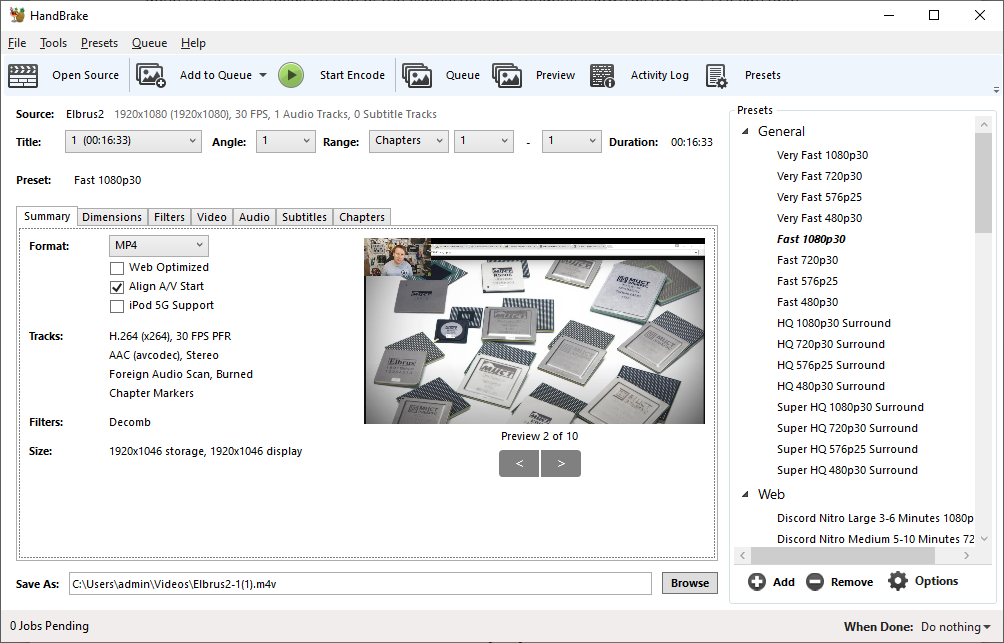
We take the compiled version of this 16-minute YouTube video about Russian CPUs at 1080p30 h264 and convert into three different files: (1) 480p30 ‘Discord’, (2) 720p30 ‘YouTube’, and (3) 4K60 HEVC.
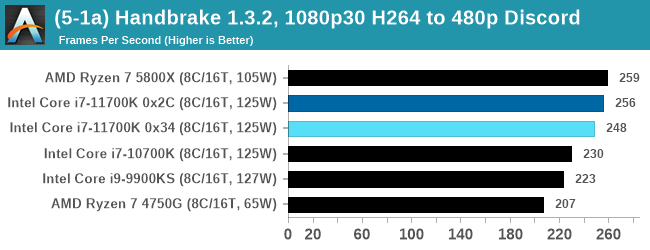
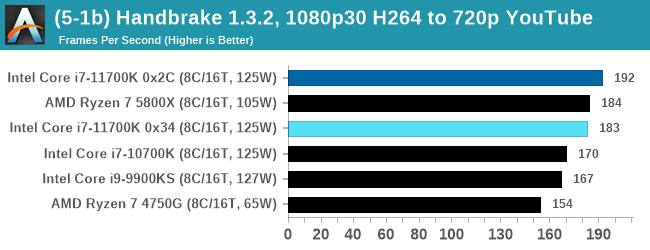
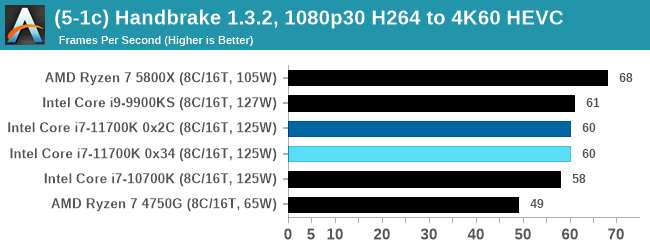
Up to the final 4K60 HEVC, in CPU-only mode, the Intel CPU puts up some good gen-on-gen numbers.
7-Zip 1900: Link
The first compression benchmark tool we use is the open-source 7-zip, which typically offers good scaling across multiple cores. 7-zip is the compression tool most cited by readers as one they would rather see benchmarks on, and the program includes a built-in benchmark tool for both compression and decompression.
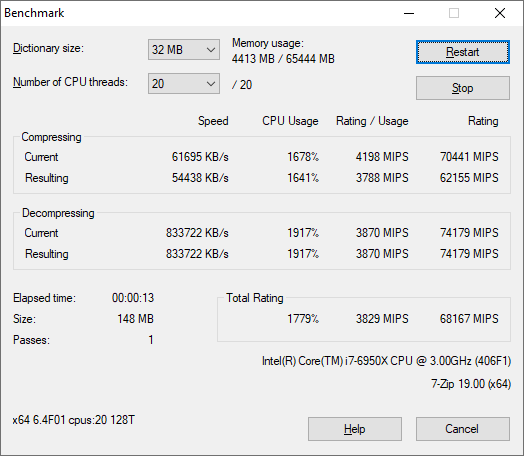
The tool can either be run from inside the software or through the command line. We take the latter route as it is easier to automate, obtain results, and put through our process. The command line flags available offer an option for repeated runs, and the output provides the average automatically through the console. We direct this output into a text file and regex the required values for compression, decompression, and a combined score.
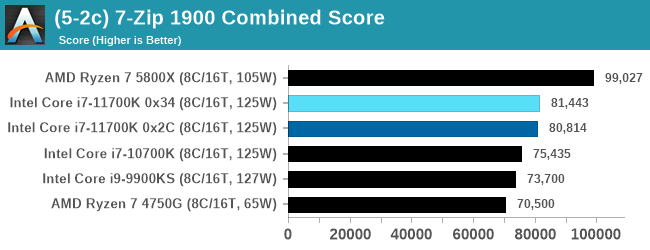
An increase over the previous generation, but AMD has a 25% lead.
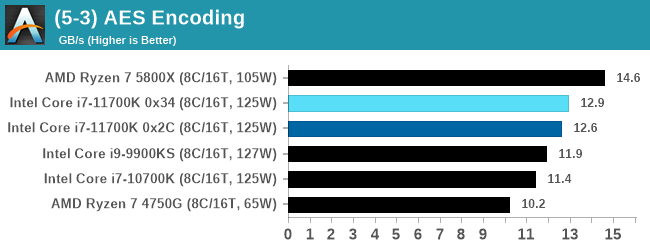
AES Encoding
Algorithms using AES coding have spread far and wide as a ubiquitous tool for encryption. Again, this is another CPU limited test, and modern CPUs have special AES pathways to accelerate their performance. We often see scaling in both frequency and cores with this benchmark. We use the latest version of TrueCrypt and run its benchmark mode over 1GB of in-DRAM data. Results shown are the GB/s average of encryption and decryption.
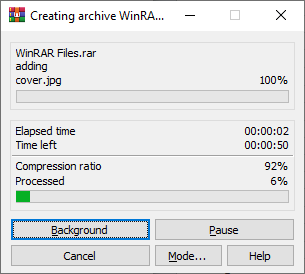
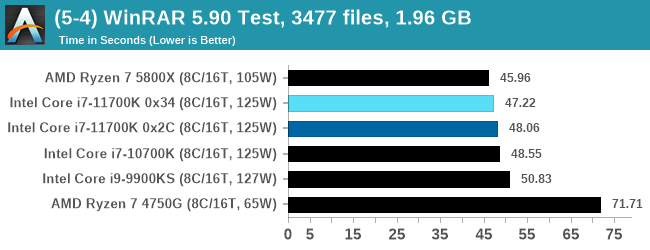
WinRAR 5.90: Link
For the 2020 test suite, we move to the latest version of WinRAR in our compression test. WinRAR in some quarters is more user friendly that 7-Zip, hence its inclusion. Rather than use a benchmark mode as we did with 7-Zip, here we take a set of files representative of a generic stack
- 33 video files , each 30 seconds, in 1.37 GB,
- 2834 smaller website files in 370 folders in 150 MB,
- 100 Beat Saber music tracks and input files, for 451 MB
This is a mixture of compressible and incompressible formats. The results shown are the time taken to encode the file. Due to DRAM caching, we run the test for 20 minutes times and take the average of the last five runs when the benchmark is in a steady state.
For automation, we use AHK’s internal timing tools from initiating the workload until the window closes signifying the end. This means the results are contained within AHK, with an average of the last 5 results being easy enough to calculate.
CPU Tests: Legacy and Web
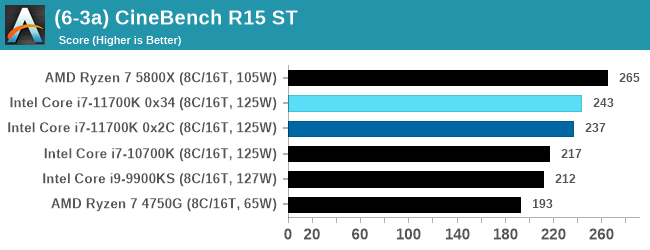
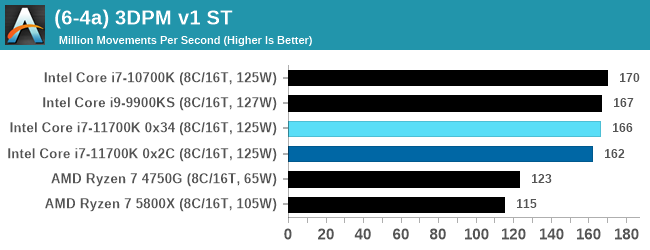
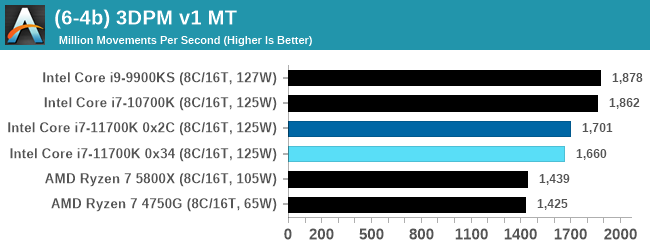
In order to gather data to compare with older benchmarks, we are still keeping a number of tests under our ‘legacy’ section. This includes all the former major versions of CineBench (R15, R11.5, R10) as well as x264 HD 3.0 and the first very naïve version of 3DPM v2.1. We won’t be transferring the data over from the old testing into Bench, otherwise it would be populated with 200 CPUs with only one data point, so it will fill up as we test more CPUs like the others.
The other section here is our web tests.
Web Tests: Kraken, Octane, and Speedometer
Benchmarking using web tools is always a bit difficult. Browsers change almost daily, and the way the web is used changes even quicker. While there is some scope for advanced computational based benchmarks, most users care about responsiveness, which requires a strong back-end to work quickly to provide on the front-end. The benchmarks we chose for our web tests are essentially industry standards – at least once upon a time.
It should be noted that for each test, the browser is closed and re-opened a new with a fresh cache. We use a fixed Chromium version for our tests with the update capabilities removed to ensure consistency.
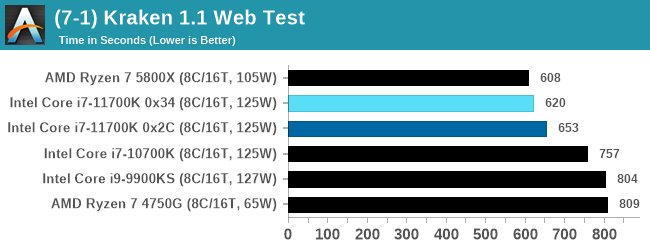
Mozilla Kraken 1.1
Kraken is a 2010 benchmark from Mozilla and does a series of JavaScript tests. These tests are a little more involved than previous tests, looking at artificial intelligence, audio manipulation, image manipulation, json parsing, and cryptographic functions. The benchmark starts with an initial download of data for the audio and imaging, and then runs through 10 times giving a timed result.
We loop through the 10-run test four times (so that’s a total of 40 runs), and average the four end-results. The result is given as time to complete the test, and we’re reaching a slow asymptotic limit with regards the highest IPC processors.
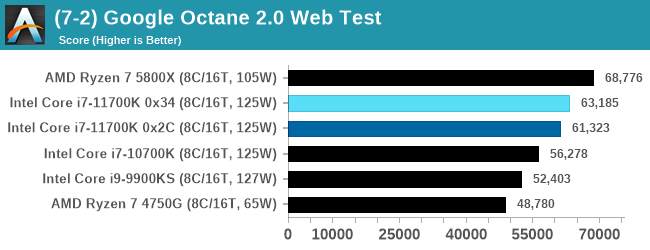
Google Octane 2.0
Our second test is also JavaScript based, but uses a lot more variation of newer JS techniques, such as object-oriented programming, kernel simulation, object creation/destruction, garbage collection, array manipulations, compiler latency and code execution.
Octane was developed after the discontinuation of other tests, with the goal of being more web-like than previous tests. It has been a popular benchmark, making it an obvious target for optimizations in the JavaScript engines. Ultimately it was retired in early 2017 due to this, although it is still widely used as a tool to determine general CPU performance in a number of web tasks.
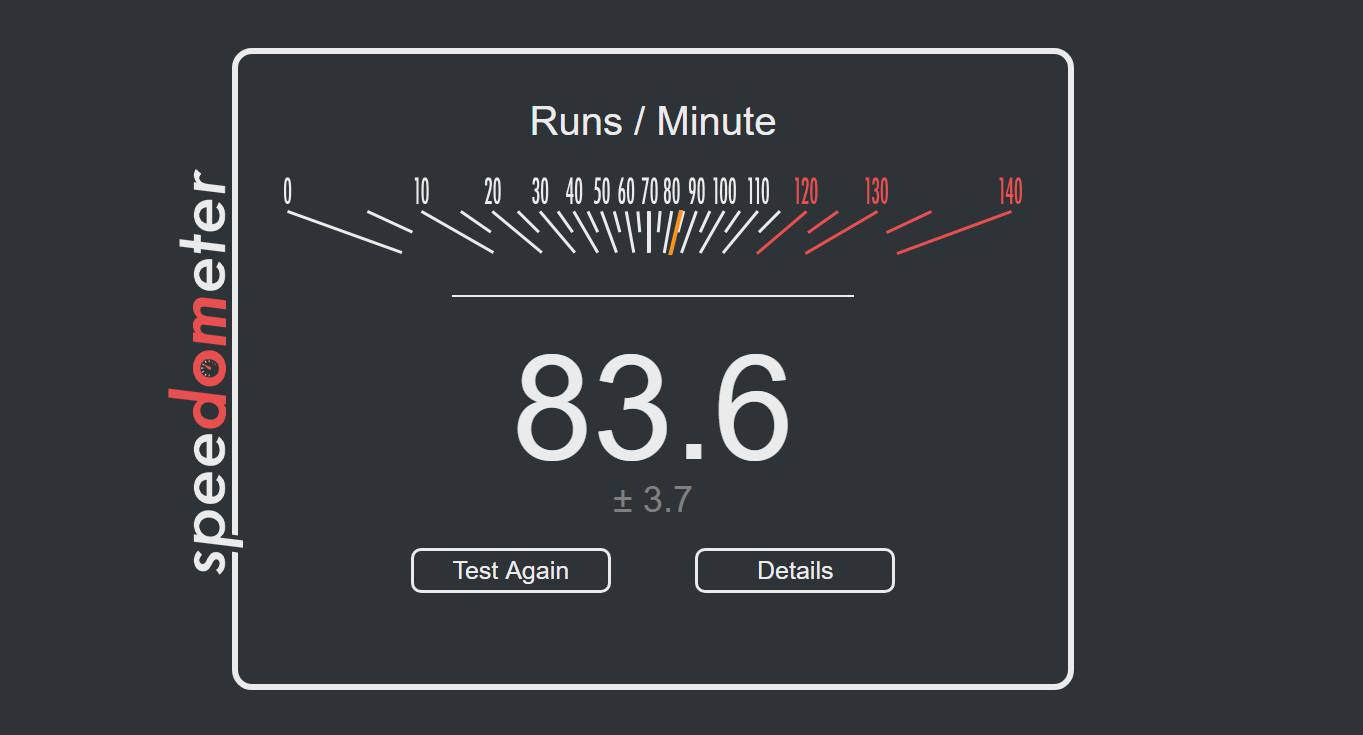
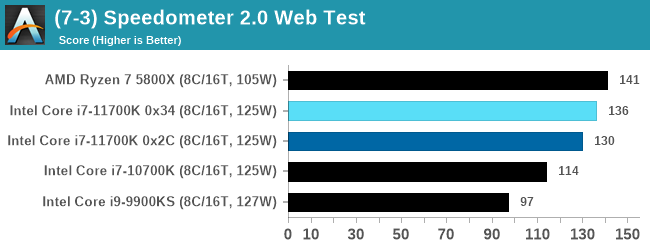
Speedometer 2: JavaScript Frameworks
Our newest web test is Speedometer 2, which is a test over a series of JavaScript frameworks to do three simple things: built a list, enable each item in the list, and remove the list. All the frameworks implement the same visual cues, but obviously apply them from different coding angles.
Our test goes through the list of frameworks, and produces a final score indicative of ‘rpm’, one of the benchmarks internal metrics.
We repeat over the benchmark for a dozen loops, taking the average of the last five.
Legacy Tests


541 Comments
View All Comments
Oxford Guy - Wednesday, March 10, 2021 - link
Worse.Bulldozer came from a money-starved little company, a company that couldn’t capitalize on having the superior design because of Intel’s monopolization.
This chip is from the big rich company that stomped on AMD with dirty tricks.
So, no. As stupid as Bulldozer was, this CPU seems to be quite a bit more unjustified.
ThereSheGoes - Wednesday, March 10, 2021 - link
Well, the results in this article are clearly not just wrong, but very wrong. https://www.hardwareluxx.de/index.php/artikel/hard...Bagheera - Wednesday, March 10, 2021 - link
did you even read the article you linked? it's taking 5800X in most benchmarks just like the Anandtech review.if you mean the gaming benches in the other review - 3 games is a terrible sample size and it still loses to 5800x in 2 out of 3.
Beaver M. - Wednesday, March 10, 2021 - link
Look at the results with the new BIOS.This review here is obsolete.
Hifihedgehog - Friday, March 12, 2021 - link
LOL. Fanboy delusion.First off, let's take a quick looksie at the Cinebench R20 results:
https://www.hardwareluxx.de/index.php/artikel/hard...
When switching from BIOS version 0402 to 0603, the 11700K's single-threaded performance actually DROPS from a score of 609 to 600. And its multicore performance is still less than the 10900K and the 5800X.
Switching gears, the games are no less unflattering:
https://www.hardwareluxx.de/index.php/artikel/hard...
The 11700K there, regardless of which of the two BIOS releases it uses, often loses to the 10900K and Ryzen 5000 series. It loses to the Ryzen 5000 series and 10900K in THREE out of the four games: The Division 2, Metro Exodus, The Shadow of the Tomb Raider.
In short: dude, what are you smoking?
Beaver M. - Wednesday, March 10, 2021 - link
As expected new reviews with newer BIOS versions improve performance significantly and puts the numbers to expected levels as well.This was a quick shot of a review and I fear it has tainted Cutress reputation a lot, especially because he defended it that much, even on video.
Oxford Guy - Wednesday, March 10, 2021 - link
With what power consumption?Raising performance by pushing power even higher may improve things like FPS in gaming tests but it obscures the big picture.
Want to talk about reputation? Remember the giant fridge-sized chiller Intel surreptitiously used to give a benchmark demo? Or, remember the ‘GenuineIntel’ fiasco? Or, remember the cute trick of putting a black box CPU inside the one people pay for, so that only special customers get the option of avoiding that particular spyware?
Somehow I think the writers here are going to be very hard pressed to challenge Intel in the cheatiness department, even without mentioning Intel’s history of abusing its monopoly power via OEM deals and the like.
Qasar - Wednesday, March 10, 2021 - link
Oxford Guy you forgot about how intel kept saying that 10 nm is " on track " the last 3-4 years :-)Qasar - Wednesday, March 10, 2021 - link
Beaver M" new reviews with newer BIOS versions improve performance significantly " from what i can tell from the graphs, for the most part, while performance may have improved over previous gen, it looks like it still looses to zen 3, but definitely not significantly, and still using more power then zen 3 overall, not that much of an improvement. a little upset that intel didnt get any performance crowns back, maybe, and that rocket lake still looks to be a dud ?
Bagheera - Thursday, March 11, 2021 - link
I fail to see the performance improvements in this other review. the games chosen were different (only 3 games? really?), and still lost to 5800X in 2/3.is it just "better" relative to last gen performance? the other review only tested a single resolution (and again, 3 whole games!)