How We Test PCIe 4.0 Storage: The AnandTech 2021 SSD Benchmark Suite
by Billy Tallis on February 1, 2021 1:15 PM ESTAdvanced Synthetic Tests
Our benchmark suite includes a variety of tests that are less about replicating any real-world IO patterns, and more about exposing the inner workings of a drive with narrowly-focused tests. Many of these tests will show exaggerated differences between drives, and for the most part that should not be taken as a sign that one drive will be drastically faster for real-world usage. These tests are about satisfying curiosity, and are not good measures of overall drive performance.
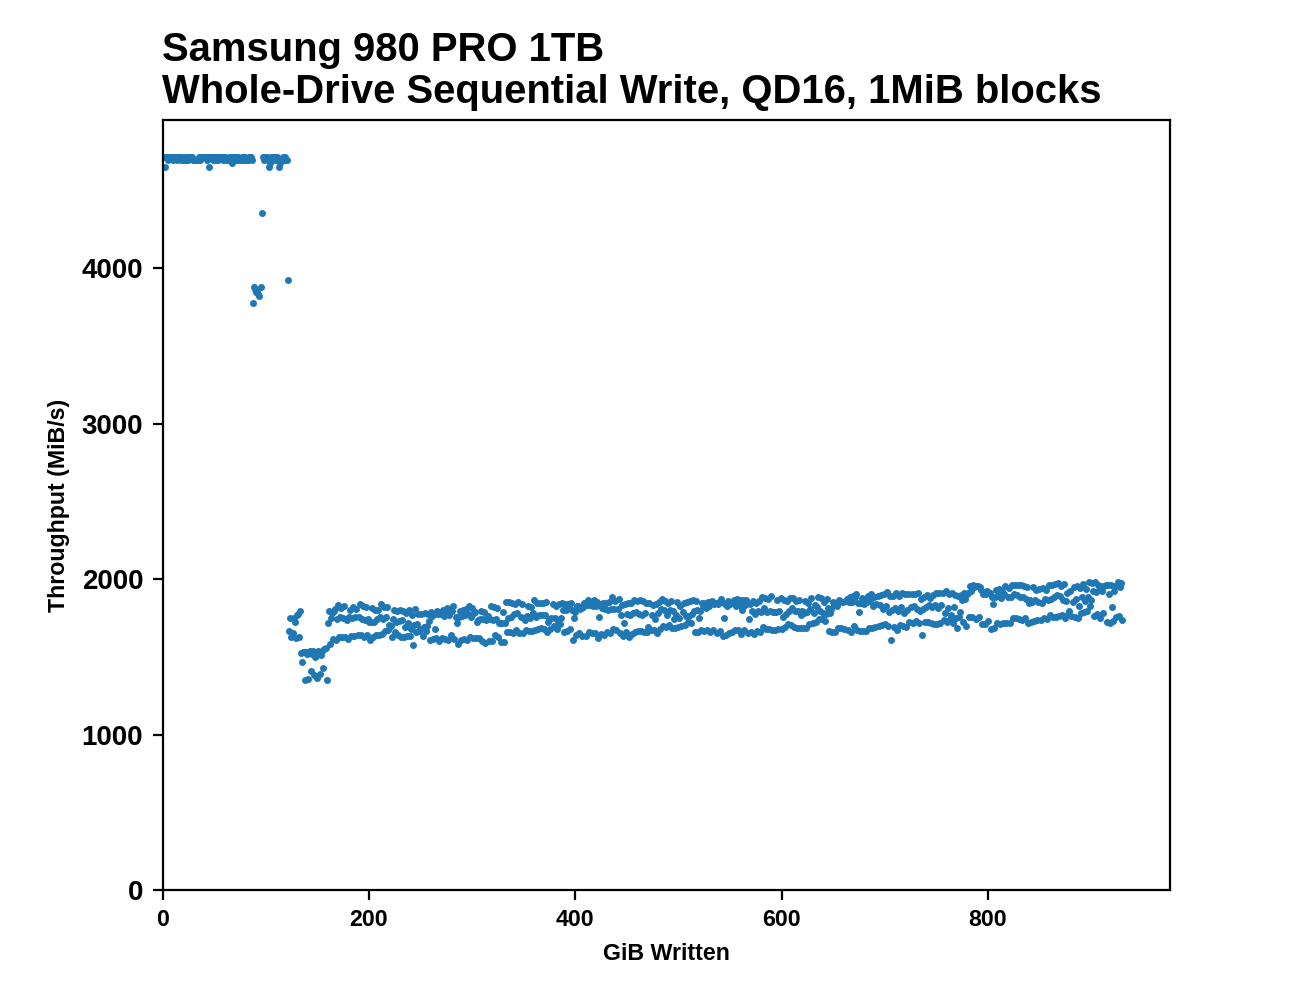
Sequential Drive Fill
The main purpose of the sequential drive fill tests are to estimate the size of a drive's SLC write cache. This test is also one of the most likely to trigger thermal throttling, because it is the longest-running sustained IO test in our suite. This test performs two passes of writing to the drive. The first is conducted after erasing the drive and giving it a few minutes to cool down and finish any background work. This first pass of sequential writes shows us the best-case SLC cache capacity, since any variable-sized cache will be at its largest when starting on an empty drive. The second pass is conducted after giving the drive some idle time and performing some read performance tests. By the time the second write pass begins, the drive should have finished any background work and we should observe the worst-case SLC cache capacity for drives that have a variable size cache.
As the second sequential write pass continues, the SLC cache will eventually be filled and even drives that don't use SLC caching will usually show some performance drop. This is pushing the drive well beyond the limits of any real-world consumer workload, so aside from any SLC cache at the beginning, performance during the second pass is irrelevant. However, since this second pass is overwriting data that was also written sequentially, the drive's garbage collection during this process is quite straightforward. Overwriting the drive with random writes instead of sequential writes would be more likely to fill the drive's spare area and induce more severe performance drops.
 |
|||||||||
| Pass 1 | |||||||||
| Pass 2 | |||||||||
 |
|||||||||
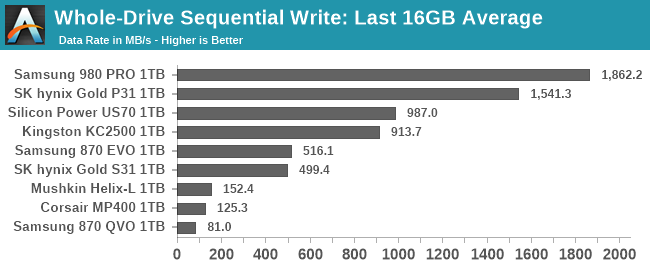
| Average Throughput for last 16 GB | Overall Average Throughput | ||||||||
After both passes of sequential writes are complete, the last 20% of the drive is TRIMed and the drive is given plenty of idle time. This prepares the drive for the battery of tests that are conducted on an 80%-full drive—full enough that SLC cache size is significantly reduced, but still leaving some empty space to avoid testing the absolute worst-case scenario of performance on a completely full drive.
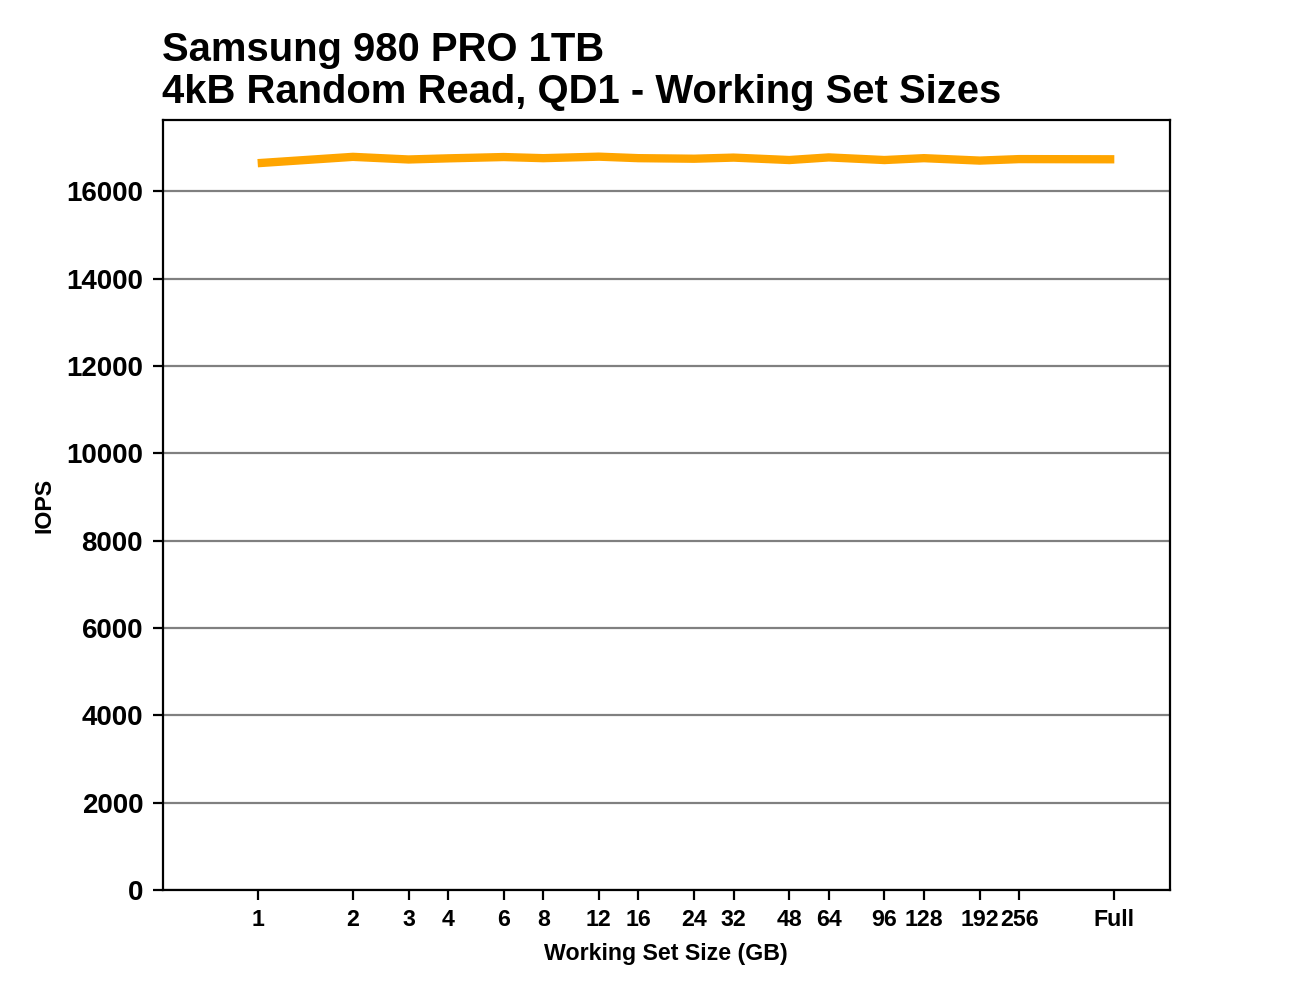
Working Set Size
This test performs random 4kB reads at queue depth 1 while varying the working set size: the size of the dataset that the random reads are coming from. When the working set size is small, the access pattern has a high degree of spatial locality, and DRAMless drives should have no trouble caching the limited amount of NAND mapping information needed to handle the reads. As the working set size increases, drives with little or no RAM are likely to show reduced performance from an increasing number of FTL cache misses. Often there is a sharp drop in performance that suggests the size of any on-controller SRAM or HMB cache in use. Drives with some DRAM but not the full 1GB per 1TB ratio may be able to handle very large working set sizes with good performance, but typically still show reduced performance when random reads span the entire drive.
 |
|||||||||
This test also provides an opportunity to verify that the TRIM command is working properly: when attempting to read data from a portion of the drive that is empty (or has been trimmed), the drive should return a bunch of zeros as soon as it has looked up the relevant LBAs in the FTL and determined that there isn't actually any real flash memory currently allocated to those addresses. So in addition to running the working set size test on a full drive, we also run it when the drive is 32GB full and 80% full, expecting to see substantially increased performance when many or most of the reads should be handled without actually touching the NAND flash memory. These extra test runs aren't included in the graphs we publish, but we're keeping an eye out for drives that don't behave as expected.
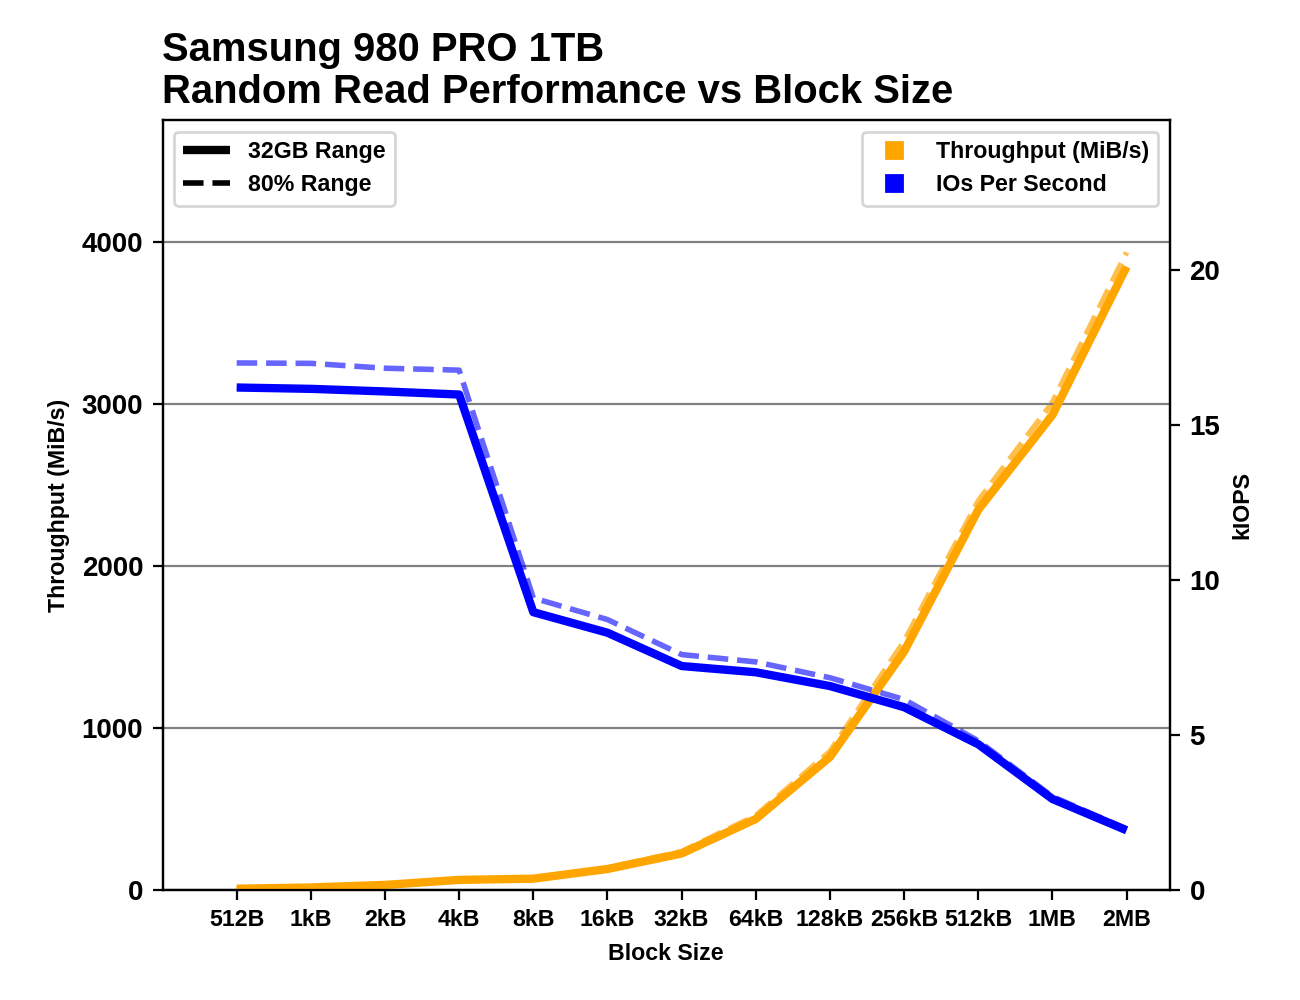
Performance vs Block Size
Industry standard practice is to measure random IO performance using 4kB operations and sequential IO performance using 128kB operations. But SSDs permit IOs as small as 512 bytes, and real-world workloads include a wide variety of actual IO block sizes. Our trace-based tests subject drives to IOs of various sizes, but are ill-suited for analyzing how specific block sizes perform.
These tests perform 1GB of IO at each block size, at a queue depth of 1 and with the usual idle time after each step. Like our other synthetic tests, they're performed both with the drive 32GB full and 80% full, to capture any differences due to things like SLC caching. Regular readers may recognize these tests as based on ones we use as part of our enterprise SSD test suite. The principle is the same, but the configuration here has been adjusted to match the rest of our synthetic tests, and we're now testing up to block sizes of 2MB. As with some of the other tests, the fact that we're testing under Linux means that IOs larger than 128kB get split up by the OS and issued to the drive as a batch. For example, IO with a 1MB block size ends up looking to the drive like eight operations of 128kB issued at the same time.
 |
|||||||||
| Random Read | |||||||||
| Random Write | |||||||||
| Sequential Read | |||||||||
| Sequential Write | |||||||||
There are several interesting phenomena to keep an eye out for. With block sizes smaller than 4kB, we generally see performance that is roughly the same IOPS as with a 4kB block size. This is a consequence of the fact that virtually all flash-based SSDs manage the NAND flash memory in 4kB chunks, even when configured to expose a 512-byte LBA size. Some drives exhibit pathologically low performance with sub-4kB block sizes, especially for writes, where a read-modify-write cycle may be necessary for the drive to preserve the data in the rest of the 4kB block.
Sequential IO with small to medium block sizes can also reveal some surprises, such as drives that seem to assume any 4kB access will be a random access and choose not to read and cache the rest of the (typically ~16kB) NAND page. Quite a few drives also show little improvement in sequential throughput with the medium block sizes, but show significant throughput scaling once the block size is well past 128kB. This is part of why we changed our burst sequential IO tests to use 1MB block sizes instead of 128kB.


70 Comments
View All Comments
edzieba - Friday, February 5, 2021 - link
I'd love to see the PCIe 4.0 drives tested at PCIe 3.0 speeds, to see how much of the performance advantage is really down to link rate vs. just newer controllers and NAND.Agent Smith - Friday, February 5, 2021 - link
Where is the Sabrent Rocket 4 PLUS ?Oxford Guy - Monday, February 8, 2021 - link
Inland Performance Plus drive does not fit in a Gigabyte Z390 UD, even though it’s an ATX board.Gigabyte managed to screw that up. The screw is too close to the expansion slot. It also conflicts with my EK CPU watercooling bracket.
Stealth ways to punish people for saving a bit of money?
Shows the importance of having actual reviews rather than specs run-through.
Oxford Guy - Monday, February 8, 2021 - link
It also shows what happens when there is a Wild West lack of standardization.It’s utterly ridiculous to buy a part and have it be impossible to install.
Kristian Vättö - Monday, February 8, 2021 - link
Inland Performance Plus is this the M.2 NVMe with a built-in heatsink? M.2 is a well-established standard with exact dimensions for everything including the screw hole. However, the standard does not include any heatsink and thus any M.2 you find with a heatsink on is a gamble in terms of compatibility.Reviews don't really help with that because it's impossible to test comptiability in +100 motherboards in all sorts of configurations.
RobJoy - Thursday, February 11, 2021 - link
What about newest PCIe 4.0 drives?XacTactX - Thursday, February 11, 2021 - link
Mr. Tallis, I'd appreciate some advice from you about the spare area of an SSD and how it impacts performance. I have a question about the numbers in this picture:https://images.anandtech.com/graphs/graph16458/hea...
I understand that an SSD has high performance when it is empty, and the performance drops off when it is full. I have two questions:
1. How much spare area do you leave on the SSDs for the full "Heavy" benchmark?
2. As a rule of thumb, how much spare area do you think needs to be left on an SSD so the performance will stay closer to the empty numbers and it will not degrade significantly, like in the full numbers
Thank you for your time.
Scour - Monday, February 15, 2021 - link
The most important thing for me is writing big amount of data which exceeds the Pseudo-SLC-Cache. And the speed if the SSD is almost full.Reviews of the speed of the Pseudo-SLC-Cache can be found often.
And I hope an Intel system with PCIe 4.0 will also be available soon in your tests :)
TechW - Wednesday, February 17, 2021 - link
Perhaps I missed it if it is being done. I'd like to see benchmarks on drives that support hardware encryption with the encryption enabled. Several new ones coming out at the end of this month now will support hardware encryption. That would be a good time to do testing with encryption enabled.saurabsfdc - Sunday, May 2, 2021 - link
how is 2 years old Kingston a2000 compared to Samsung 980.i guess except sequential read write which is higher in Samsung 980 , random read write might be lower than Kingston . Also Kingston consumes less power than Samsung 980 as per data sheet.