How We Test PCIe 4.0 Storage: The AnandTech 2021 SSD Benchmark Suite
by Billy Tallis on February 1, 2021 1:15 PM ESTSynthetic Tests: Basic IO Patterns
Our first batch of synthetic benchmarks exercise the four basic IO patterns: random reads, random writes, sequential reads, and sequential writes. These are the figures most often quoted on SSD spec sheets, with the fine print delineating test conditions designed to produce the largest possible numbers. Our tests are intended to reflect more realistic conditions of low queue depths, though we do also include some tests that get up to very high queue depths.
The biggest change here from our previous SSD test suite is that all of these tests are now run twice: first on a mostly-empty drive with the test confined to the first 32GB of the drive, and later with the drive 80% full and the test allowed to touch any part of that 80%. The intention here is to capture some of the impact of SLC caching and DRAMless or reduced-DRAM designs. The test runs given free reign over 80% of the drive will show much less spatial locality than the 32GB range runs, so drives that do not have a full-size DRAM buffer to cache their FTL mapping tables will generally show worse random access performance for the wide-range tests. Running tests with the drive 80% full also means drives with a variable-size SLC cache will have had to shrink the cache size down to its minimum size (or very nearly), which means write tests will be much more likely to overflow what SLC cache remains. Drives that optimistically keep data in their SLC caches to accelerate reads will also tend to suffer on the wide-range tests where most of the data accessed cannot still be in the cache.
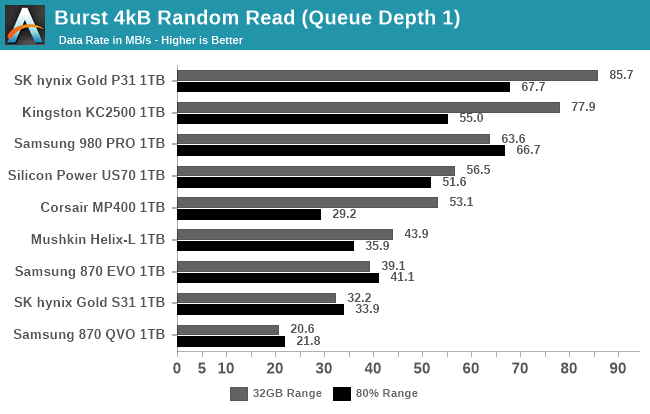
Burst IO Performance
First up, we have a series of tests at queue depth 1 measuring performance on short bursts of IO. The random read and write tests consist of 32 bursts of up to 64MB each. The sequential read and write tests use eight bursts of up to 128MB each. Each burst is limited to a maximum of one second, though that limit should only come into play for particularly slow drives.
Contrary to standard industry practice, these sequential read and write test are configured to perform 1MB operations rather than 128kB. We made this choice because disk traces show that the sequential IO produced by moving large files around with Windows results in 1MB chunks of IO, so these burst sequential IO tests are a decent proxy for simple file copying tests, and are somewhat more representative of real-world IO patterns than issuing 128kB requests one at a time. However, since these tests are run on Linux, the OS will split up these IOs into 128kB segments and issue them to the drive as a batch of 8 commands, although that doesn't much change the chunkiness of the IO. This change to 1 MB is likely to particularly benefit drives optimized for 1 MB chunks, and we've previously noticed a number of popular controllers focusing on this size for IO, despite most spec sheets only focusing on 128 kB.
 |
|||||||||
| Random Read | Random Write | ||||||||
| Sequential Read | Sequential Write | ||||||||
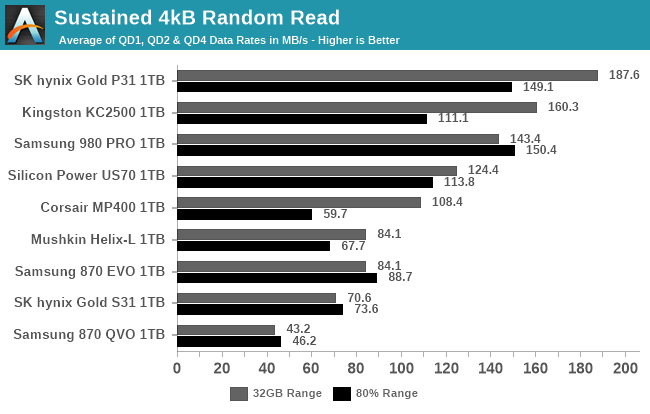
Sustained IO Performance
Our sustained IO tests have also changed a bit, aside from the split to test both narrow and wide ranges of the drive. We're still testing the four basic IO patterns at a range of queue depths (now going up to QD128), but placing the most importance on performance at the low queue depth most commonly produced by real-world usage.
Each sub-test is permitted to run for much longer than our burst IO tests, but we still place strict limits on these tests: the test for each queue depth and IO pattern is allowed to transfer up to 16GB, and to run for no more than 30 seconds (sequential IO) or 10 seconds (random IO). After each test that only reads data, the drive is given idle time equal to the duration of the test phase that just completed. After tests that write data, the idle time is five times longer, to allow for the drive's background cleanup processes to make progress. The random read and write tests are multithreaded and will use up to four threads to perform IO, so the QD32 test phase consists of four threads each operating at QD8. The sequential IO tests are all single-threaded regardless of queue depth, and move to a new random location within the test range after each 128MB of IO, in order to avoid constantly hammering the same LBAs on each iteration. (This can be thought of as representing a mild degree of filesystem fragmentation.)
Since these tests run longer than the blink of an eye durations of the burst IO tests, we're able to take meaningful power measurements, and compute power efficiency metrics (performance per Watt) for each test.
The primary scores we report for each test are an average of the measured performance/power/efficiency at queue depths 1, 2 and 4. Weighting those three equally is a fairly arbitrary choice, but we feel it does a fine job of representing a somewhat realistic distribution of queue depths.
 |
|||||||||
| Random Read: | Performance | Power | Efficiency | ||||||
| Random Write: | Performance | Power | Efficiency | ||||||
| Sequential Read: | Performance | Power | Efficiency | ||||||
| Sequential Write: | Performance | Power | Efficiency | ||||||
 |
|||||||||
| Random Read | |||||||||
| Random Write | |||||||||
| Sequential Read | |||||||||
| Sequential Write | |||||||||
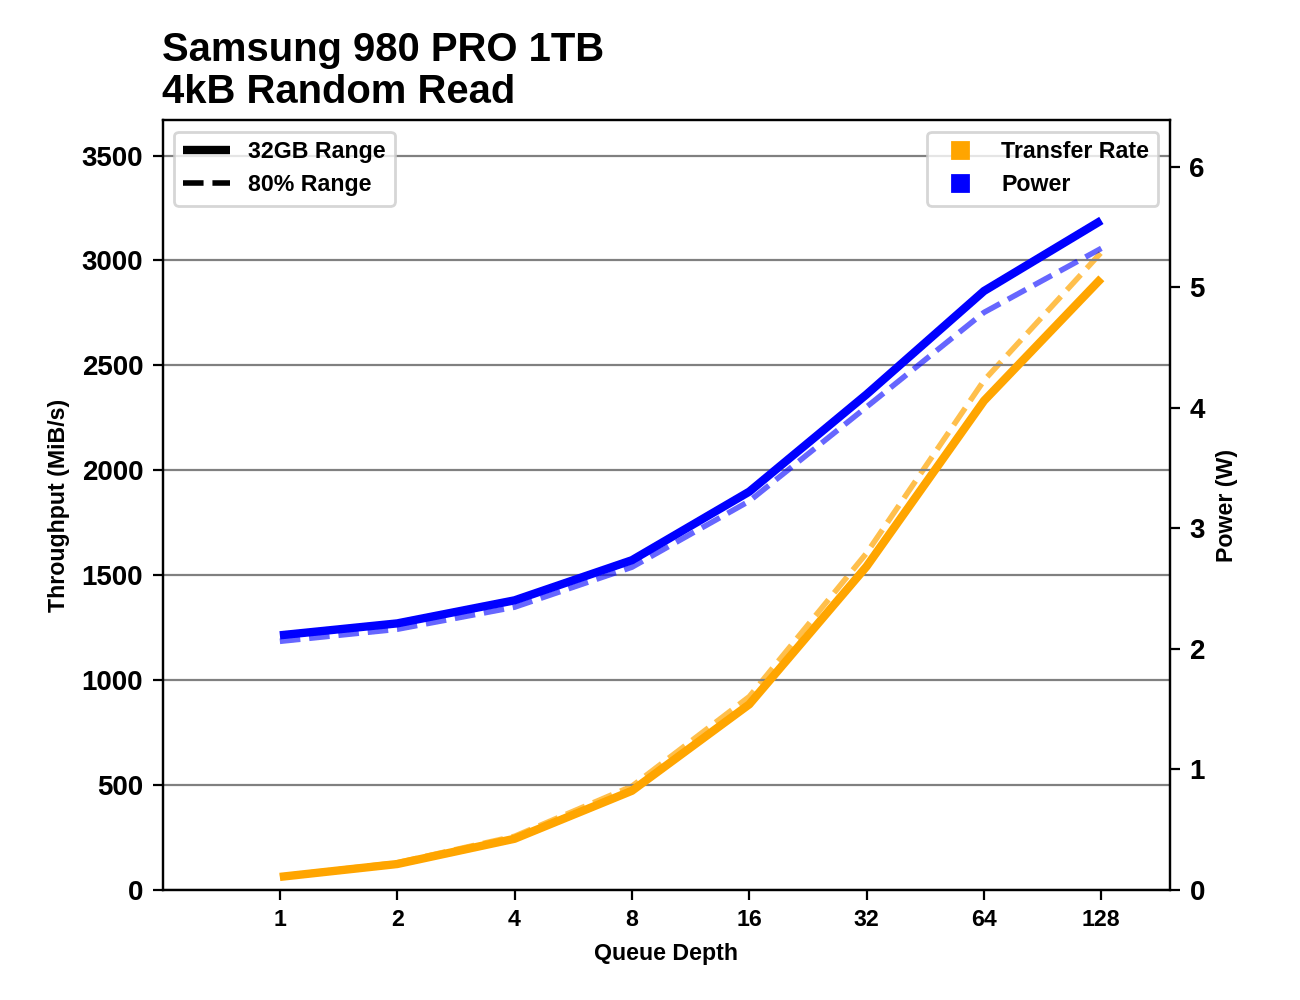
Digging into the detailed graphs for each drive shows that the latest high-end NVMe SSDs continue to show increased performance as queue depths climb to insane levels. We could have extended these tests far beyond QD128, but we're already well into the fantasy realm of silly benchmarks. There are also some very striking discrepancies between the narrow 32GB range testing and the 80% full drive testing, especially on the write tests.
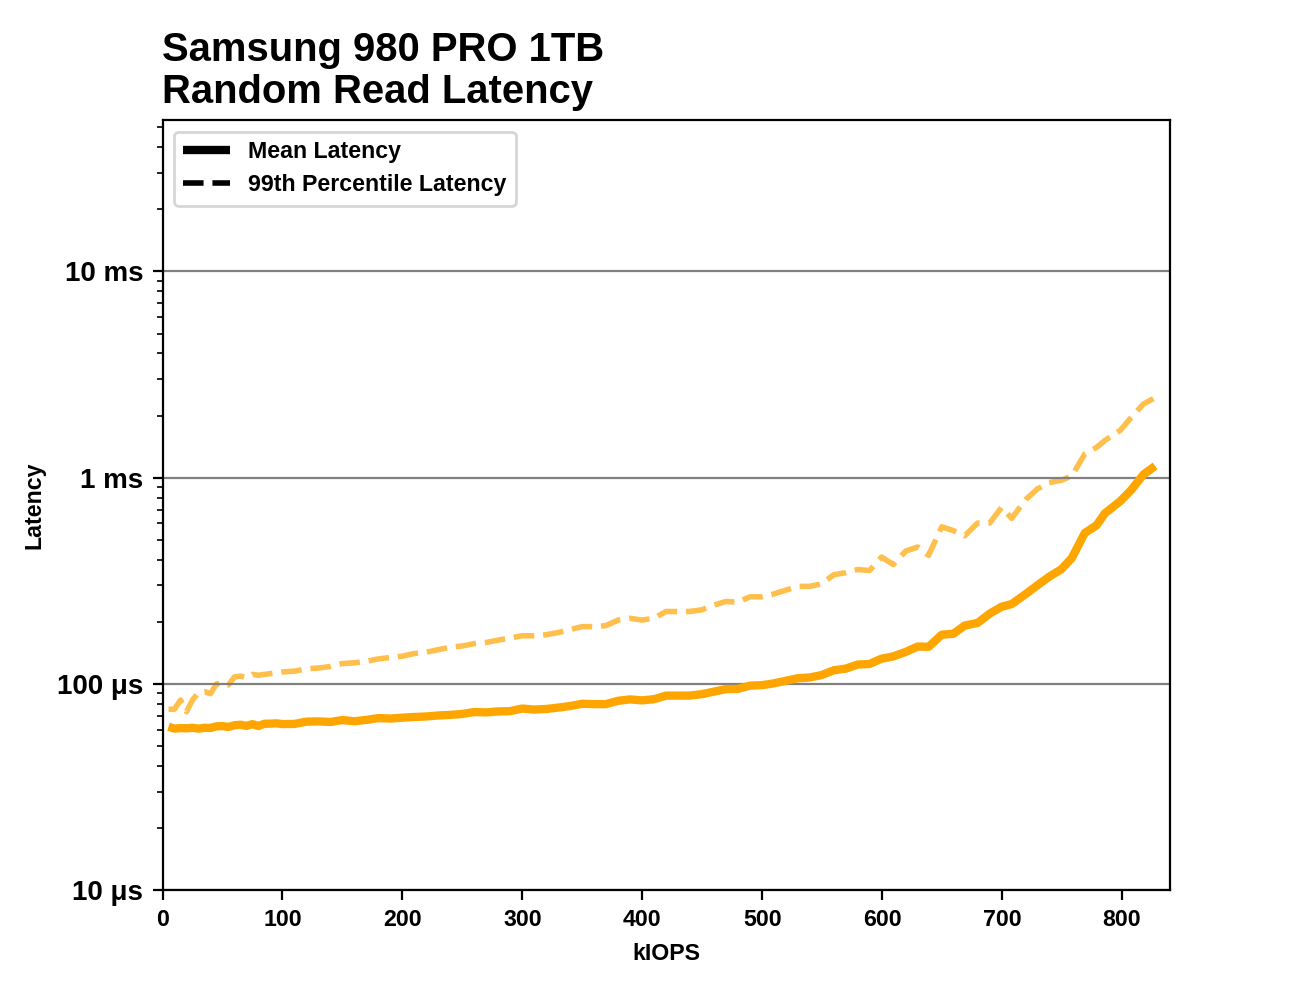
Random Read Performance Consistency
Next up is a test borrowed from our enterprise SSD benchmark suite. This test is designed to measure the latency and performance consistency of a drive during sustained random reads. Measuring latency during our other sustained IO tests can produce misleading scores because those tests run at specific fixed queue depths. There are two main problems with this approach. First, if the queue depth is higher than what's necessary to get full performance out of the drive, then every operation will have to wait in the queue for some time before the drive starts working on it. That inflates all the latency metrics by an amount proportional to how much larger the queue depth is than necessary for that particular drive.
The second problem is a bit more subtle. In the real world, new IO requests don't stop showing up just because the drive already has eg. four or eight requests already pending, and if a drive stalls while handling one particular request, new IO commands will build up in the queue. A test that runs at a fixed queue depth will only record a handful of high-latency operations during a performance stall; this is called the coordinated omission problem. The solution is a test that issues IOs at a fixed rate, and lets queue depth be a consequence of the drive's performance.
This test issues 4kB random reads at increasing rates until the drive can't keep up. At each rate tested, the test performs 4GB of random reads (split across 4 threads), for a total of just over a million IOs. We report the average and 99th percentile latency at each rate, starting from 5k IOPS and increasing until the drive cannot sustain the requested rate. This test doesn't include any idle time between steps, so toward the end it is considerably more intense than real-world consumer workloads.
This test is only performed for random reads. Sequential reads and writes are usually not so latency-sensitive for consumer workloads: either the software only cares about when the entire sequential transfer is done, or it's streaming data and the application or OS can perform buffering and prefetching in RAM. Random writes can also be buffered in RAM, and SLC caching would give this test messy results on most consumer drives.
 |
|||||||||
Most drives show a gradual increase in latency that becomes much steeper as the test approaches the drive's maximum throughput. The testing doesn't cut off until the drive is delivering at least 5% less than the requested rate, but we cut the graphs off a bit earlier than that: stopping at the last step before the drive's actual (rather than requested) performance is within 1% of its true maximum throughput. Without trimming off the end of the curve, basically every drive's graph would end in a vertical line that distorts the scale of the graph.
Occasionally a drive's performance Quality of Service (QoS) will be bad enough that it fails out of the test early, long before its theoretical throughput limit has been reached. That would be a serious concern for an enterprise drive, but for consumer drives it's only an issue if it happens very early in the test at low speeds. Typical real-world consumer workloads don't produce an uninterrupted stream of random reads like this test, and when a consumer SSD has QoS problems it's usually because some slow write operations are getting in the way of read operations.
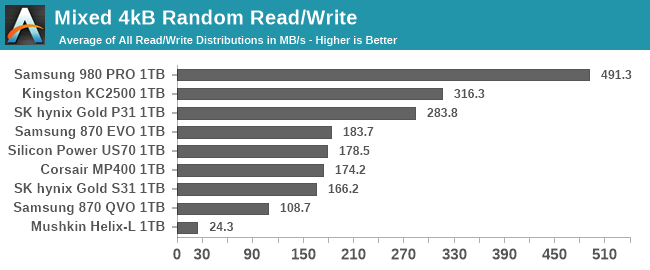
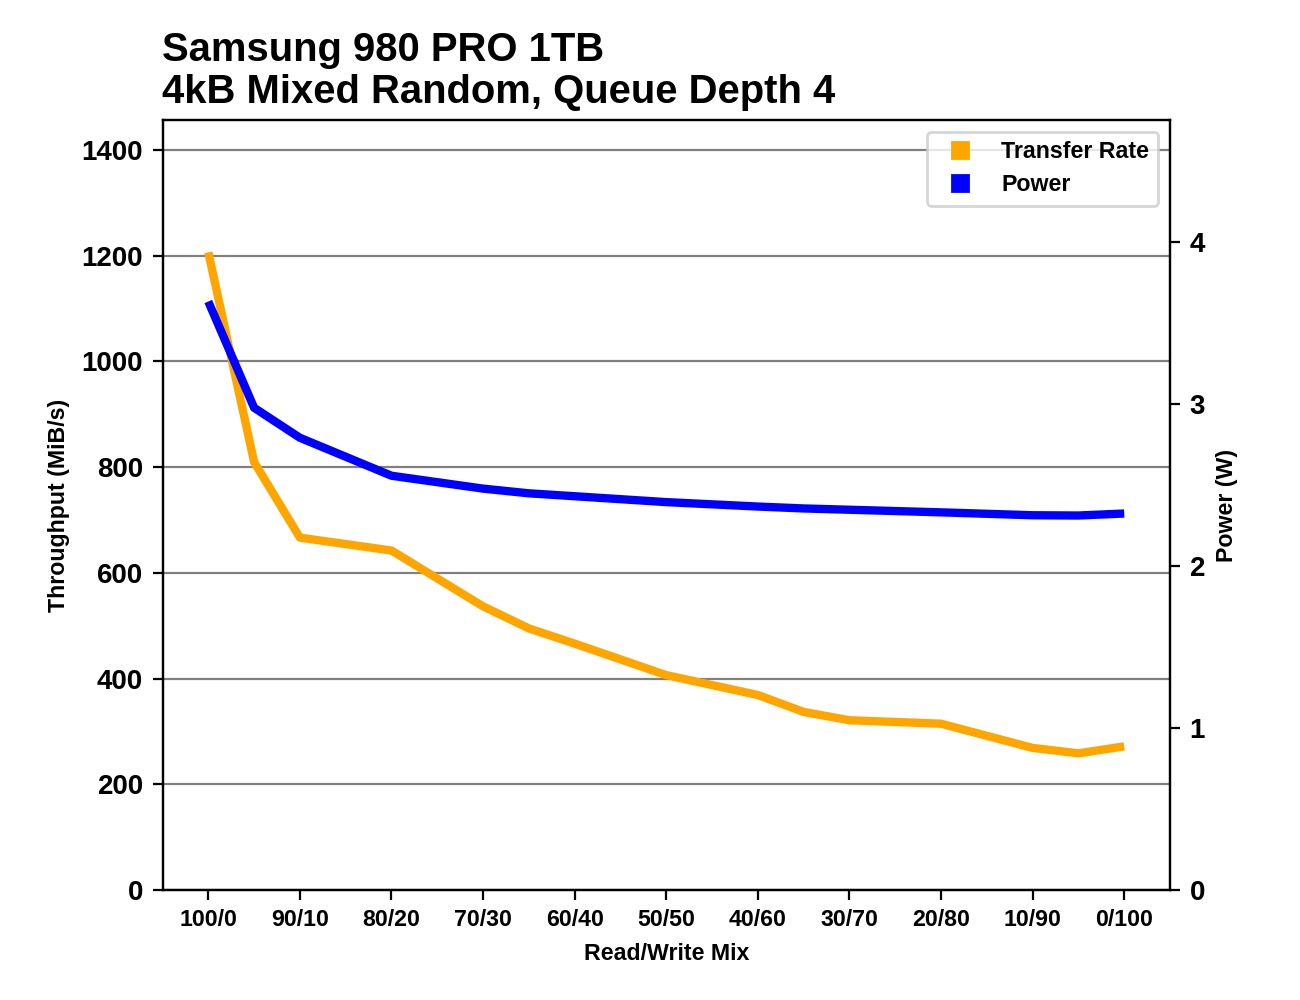
Mixed IO Performance
The trace-based tests in our benchmark suite do a pretty good job of covering realistic patterns of mixed reads and writes. These synthetic tests of varying mixes of reads and writes aren't intended to emulate any particular real-world usage, but are more about observing how performance scales as the balance between reads and writes is adjusted. Most consumer IO tends to involve more reads than writes, but these benchmarks test read-heavy and write-heavy workloads equally.
The changes to our synthetic tests of mixed read/write workloads are similar to the modifications for the other sustained IO tests. However, on this one we're not bothering to split it into versions running against a 32GB slice of the drive and an 80% full drive: the only versions here are the 80% full tests.
Both the mixed sequential and mixed random IO tests use four threads each running at QD1, for a total queue depth of 4. The mixed sequential IO test has been switched to use 1MB operations rather than 128kB, which means there's considerably more data in flight than our old 128kB @ QD1 mixed sequential IO test.
Each workload mix is tested for at most 10 seconds/16GB (random IO) or 30 seconds/16GB (sequential IO). The main scores reported here are averages across all the mixes tested. A good score usually indicates a well-rounded drive that handles write pressure well, but a poor score here doesn't necessarily translate into anything worth worrying about for a consumer.
 |
|||||||||
| Mixed Random IO: | Performance | Power | Efficiency | ||||||
| Mixed Sequential IO: | Performance | Power | Efficiency | ||||||
 |
|||||||||
| Mixed Random IO | |||||||||
| Mixed Sequential IO | |||||||||


70 Comments
View All Comments
nobozos - Tuesday, February 2, 2021 - link
One thing that bothers me about benchmarks in general is that they often don't show the statistics normalized against the cost of the thing being measured. For example, I'd like to see iops/$, or GBs/$, or ???/$ in all your tables and charts. I think you've sometime done this in the past, but it should become a regular feature of every review.kepstin - Tuesday, February 2, 2021 - link
Prices are so volatile in the market (and sometimes even regional) that a static number here doesn't make sense imo. The periodic roundups of recommended drives do take price and performance into account.KarlKastor - Tuesday, February 2, 2021 - link
@BillyThank you for the detailed test and the explanation of each procedure.
There is one thing that I am missing in this test. How does a drive perform in heavy and light, if it is 80 or 90% full?
Is it closer to a fresh drive or closer to full drive?
Maybe you can run a drive in that precondition. Not as a general test, but just once to show how a drive behaves.
Oxford Guy - Tuesday, February 2, 2021 - link
Great article. I particularly agree with the use of 80% full because that's a lot more realistic than empty drive testing. In fact, I would skip empty drive testing and stick with 60% and 80% full tests.• Having three Samsung drives out of nine shown seems like an ad for Samsung, even if that wasn't the intention. That Samsung is a popular brand is not a good reason. OCZ used to be popular and the company's bad practices caught up with it.
• Please test the Inland brand drives. People can find Samsung drive tests all over the Internet. I'm not saying don't test them, of course. I am asking that you provide significantly more added value to your SSD reviews by reviewing drives almost no one else reviews. For instance, I recently purchased the 2 TB Inland Performance Plus drive, which uses the Phison E18 controller. It should provide very good performance but reviews would help.
Another issue with brands like Inland is firmware updates. Sandforce, the most infamously poor-quality SSD controller outfit, finally (they claimed) fixed a serious bug in their second-generation controller years ago and OCZ released yet another firmware update. Yet, other brands were sold using the controller and the OCZ tool wouldn't recognize them so they could be patched. Sandforce, of course, never bothered to provide a utility for patching these other brands' drives.
This issue isn't so severe if the consumer just happened to have purchased a Sandforce drive from a vendor that sometimes makes the effort to create patches, like Intel. But, it's really inexcusable to have such a caveat emptor attitude that one doesn't make a strong effort to warn consumers about any risks involved in buying drives from less dominant brands. Phison, for instance, has reportedly been working on improving the firmware for the E18. Will Inland ever receive a patch? I haven't looked much into it but when I did a a few cursory searches about Inland and firmware patches over the years it seemed that it was the typical "off brand" situation — where the drives are stuck forever with their initial firmware.
That's not such a severe problem if the firmware is decent to begin with (unlike OCZ, which, despite dozens of updates never fixed the Vertex 2 drive at all) — but it's something Anandtech should be and should have been raising awareness about. Your site covered OCZ's bait and switch tactics (when it switched 32-bit NAND in the Vertex 2 for 64-bit NAND, causing the drives to brick randomly — especially when put to sleep), which was great.
But, unless I missed it I haven't seen any articles about the drawbacks of purchasing SSDs from smaller brands. And, why not put some pressure on the industry to stop enabling companies like Sandforce to not provide utilities to patch their drives (and utilities to un-brick them when they go into 'panic mode'). It was completely inexcusable — the industry silence around that. Sandforce made it much more important to brick the drive when there was a software glitch, no matter how minor, apparently to 'protect its IP'. Shouldn't the consumer's data be considered the priority? Well, they came out with a not-at-all-conflict-of-interest partnership with DriveSavers. That's right — you get the joy of a drive that will brick at any moment and then you can spend thousands to 'protect the vaunted Sandforce IP' and pad its pockets and DriveSavers'.
The tech press is supposed to protect us from caveat emptor. So, please... start reviewing smaller brands, start providing a bigger picture than the latest from Samsung, and put more pressure on industry players (like Inland) to do the right things, like keeping their drives' firmware current.
Oxford Guy - Tuesday, February 2, 2021 - link
Speaking of bad practices, let's take a look at Samsung.1. The company breaks industry convention and intentionally confuses consumers by labeling QLC drives "MLC", and TLC drives as well. That's an example of fraud which is, unfortunately, legal.
There should have been an article from every tech site condemning this. I don't recall seeing even one. You know, it's not too late, either!
2. The company posted fantasy power consumption figures for drives like the 830 and the tech press and companies like Newegg dutifully posted those specs. Samsung sold a lot of drives based on word of mouth — about how amazingly efficient its drives were, based on those nonsensical power usage claims.
3. The company released its planar TLC drives in such an under-engineered (half-baked) state that they had to be kludged into frequently rewriting stored data to keep their performance somewhat acceptable. The steady state performance of the 128 GB 840 drive earned particular, fully justified, scorn from HardOCP.
Kristian Vättö - Tuesday, February 2, 2021 - link
All SSDs with a Phison controllers are the same - designed and assembled by Phison. Sure, there are some FW differences as every customer can request customisations, but at a high-level an SSD with a Phison controller is a Phison SSD. None of the small brands produce their own SSDs, they simply work with Phison and other similar ODMs who offer turnkey solutions. Anyone can start their own brand if they have enough capital to meet the MOQ requirements.It was different 10 years ago when there were numerous incumbent controller and SSD vendors shipping new designs every 6-12 months ago. At that time, it was never sure what to expect and at AT we were more or less a validation partner even. Nowadays there are a few large factories pumping out stuff with different labels.
Oxford Guy - Tuesday, February 2, 2021 - link
The Sandforce 2200 controller was used by a bunch of different companies but to my knowledge it’s not possible to patch that bug if one owns one of the smaller brands’ drives. It’s unlikely enough to get OCZ’ utility to recognize its own drives, let alone another vendor’s.So, even if the controller is the same and even if the other hardware is standard, is there a standard utility that can be used with any drive made by any brand? Sandforce never seemed to bother to offer anything like that and there were a lot of different brands using its controllers.
Also, even when a controller is standard the firmware may not be, as in the case of Intel’s Sandforce drives as far as I know.
Oxford Guy - Tuesday, February 2, 2021 - link
So my question remains: are all the Inland drives able to be firmware-updated and secure erased?Or, are such ‘small brand’ drives locked out of those things?
rahvin - Tuesday, February 2, 2021 - link
Why would they offer a tool when they can charge the OEM to produce a branded tool for those drives only?There's little incentive for an ODM to provide anything they aren't paid for and their customers aren't the retail buyers, it's the OEM's.
Billy Tallis - Tuesday, February 2, 2021 - link
Samsung's over-represented in this article mainly because they're one of the few companies still sampling new SATA drives for review, and I didn't want to have the SATA market segments represented by old 64-layer drives that you can no longer purchase.As for the Inland drives: I don't have any easy way to get samples of a large number of their drives. I strongly prefer not wasting time re-testing the same drive with a different brand's sticker. I do plan to soon have full results for E12+TLC, E12S+QLC, E16+TLC, E16+QLC drives in Bench, and I'll be getting an E18 sample soon. They won't all be from the same brand, but the results will be generally representative of the equivalents from other Phison-based brands.
I also wish the smaller SSD brands did a better job of making firmware updates available. That is definitely a valid reason for preferring some brands over others. It's a little hard to evaluate vendors on the timeliness of their firmware update releases at product launch, and I've never made it a priority to systematically compare vendors on this post-launch.
Part of why it's been a low priority has been because it seems like firmware updates are generally not as important these days. When a controller is first launched there are often a few updates to optimize performance, but those usually don't have a big impact on the overall standings of a drive. Firmware updates to fix critical bugs seem to be thankfully less common. And for users who really do care about making sure they've got the absolute latest firmware on their Phison drives, you can usually find a way to apply the update using a different vendor's tool—not ideal by any means, but it works.