AMD Zen 3 Ryzen Deep Dive Review: 5950X, 5900X, 5800X and 5600X Tested
by Dr. Ian Cutress on November 5, 2020 9:01 AM ESTTDP and Power Draw: No Real Surprises
The nature of reporting processor power consumption has become, in part, a dystopian nightmare. Historically the peak power consumption of a processor, as purchased, is given by its Thermal Design Power (TDP, or PL1). For many markets, such as embedded processors, that value of TDP still signifies the peak power consumption. For the processors we test at AnandTech, either desktop, notebook, or enterprise, this is not always the case.
Modern high performance processors implement a feature called Turbo. This allows, usually for a limited time, a processor to go beyond its rated frequency. Exactly how far the processor goes depends on a few factors, such as the Turbo Power Limit (PL2), whether the peak frequency is hard coded, the thermals, and the power delivery. Turbo can sometimes be very aggressive, allowing power values 2.5x above the rated TDP.
AMD and Intel have different definitions for TDP, but are broadly speaking applied the same. The difference comes to turbo modes, turbo limits, turbo budgets, and how the processors manage that power balance. These topics are 10000-12000 word articles in their own right, and we’ve got a few articles worth reading on the topic.
- Why Intel Processors Draw More Power Than Expected: TDP and Turbo Explained
- Talking TDP, Turbo and Overclocking: An Interview with Intel Fellow Guy Therien
- Reaching for Turbo: Aligning Perception with AMD’s Frequency Metrics
- Intel’s TDP Shenanigans Hurts Everyone
In simple terms, processor manufacturers only ever guarantee two values which are tied together - when all cores are running at base frequency, the processor should be running at or below the TDP rating. All turbo modes and power modes above that are not covered by warranty.
For AMD’s new Ryzen 5000 processors, most of them have a 105 W TDP, with a Package Power Tracking (PPT) setting of 142 W. For these processors, we can see our peak power consumption through our testing matching that value. For the sole 65 W processor, the PPT value is 88 W, and we’re seeing only 76 W, showing some of the efficiencies on the Ryzen 5 5600X.
If we look directly at the Ryzen 9 5950X for chip wide power consumption over per-core loading, we get this following graph. Here we are reporting two of the values that we have access to on the chip, which the chip estimates as part of its turbo detection and action algorithms: total package power (for the whole chip), and the power solely used by the sum of cores, which includes the L3 cache. The difference between the two covers the IO die as well as any chiplet-to-chiplet communications, PCIe, CPU-to-chipset, and DRAM controller consumption.
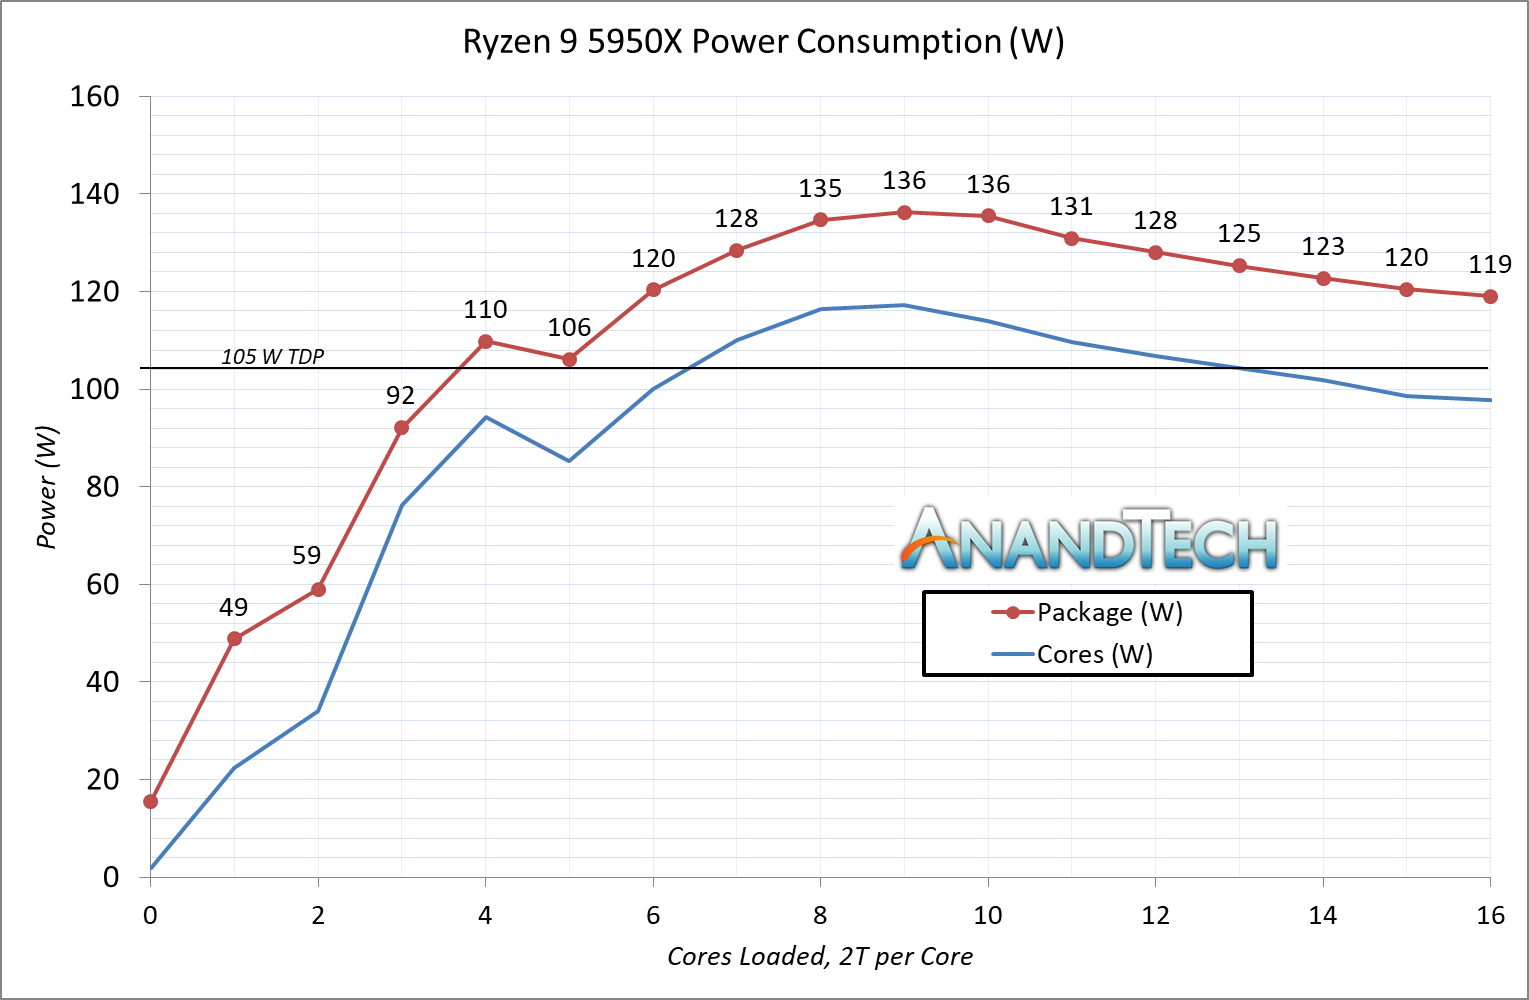
There are two significant features of this graph.
First is the hump, and a slow decrease in total package power consumption after 8-10 core loading. We saw this when we first tested the previous generation 3950X, and is indicative of how the processor has increased current density as it loads up the cores, and as a result there’s a balance between the frequency it can give, delivering the power, and applying the voltage in a consistent way. We’re seeing the difference between the two values also increasing slightly, as more data is transferred over those off-chiplet communications. We see this effect on the 5900X as well, perhaps indicating this is a feature of the dual chiplet design – we’re not seeing it on the 5800X or 5600X.
The second feature is an odd dip in power moving from 4 to 5 cores loaded. Looking into the data, the frequency of the active cores drops from 4725 to 4675, which isn’t a big drop, however the voltage decreases from 1.38 V to 1.31 V, which seems to be more sizeable drop than other voltage readouts as we scale the core-to-core loading. There’s also a bigger increase in non-core power, up from 16 W to 21 W, which perhaps decreases the power to the cores, reducing the voltage.
This might be an odd quirk of our specific chip, our power test, or it might be motherboard or BIOS specific (or a combination of several factors). We might go back in future on other boards to see if this is consistent.
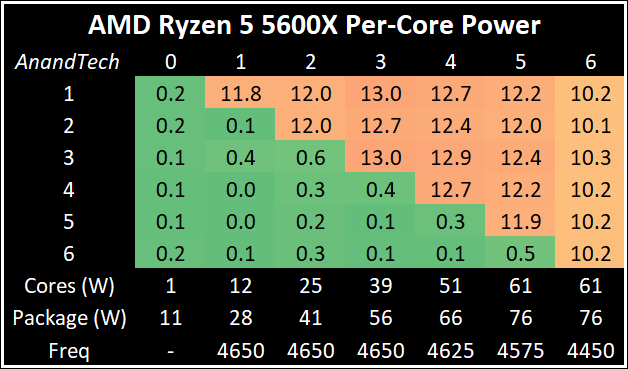
When we dive into per-core power loading, we get the following:
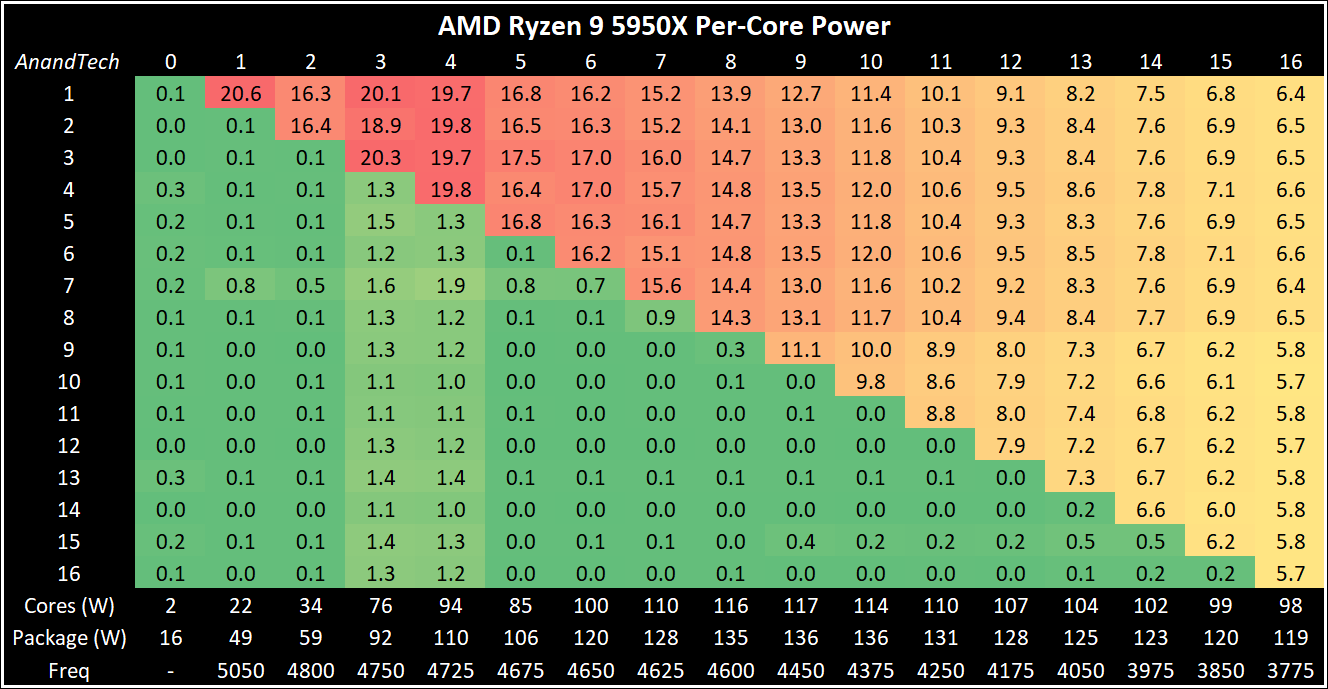
The big chip’s power distribution seems to go up in that 3-4 core loading before coming back down again. But as we load up the second chiplet moving from 8 to 9 core loading, it is worth noting that the second chipset is reporting lower core power, despite showing the same core frequency. AMD is able to supply the two chiplets different amounts of voltage and power, and we might be seeing this play out in real time.
Perhaps very important is that single core power consumption when we are at 5050 MHz of 20.6 W. Going back to our previous generation data, on Zen 2 we were only seeing a peak of 18.3 W, and a slightly higher voltage reported (1.45 V for Zen 2 vs 1.42 V for Zen 3). This means that from the perspective of our two chips, Zen 3 cores scale better in frequency, and even though the power increases as expected, the voltage simultaneously decreases (Note that there can be some silicon variability to also account for some of this.)
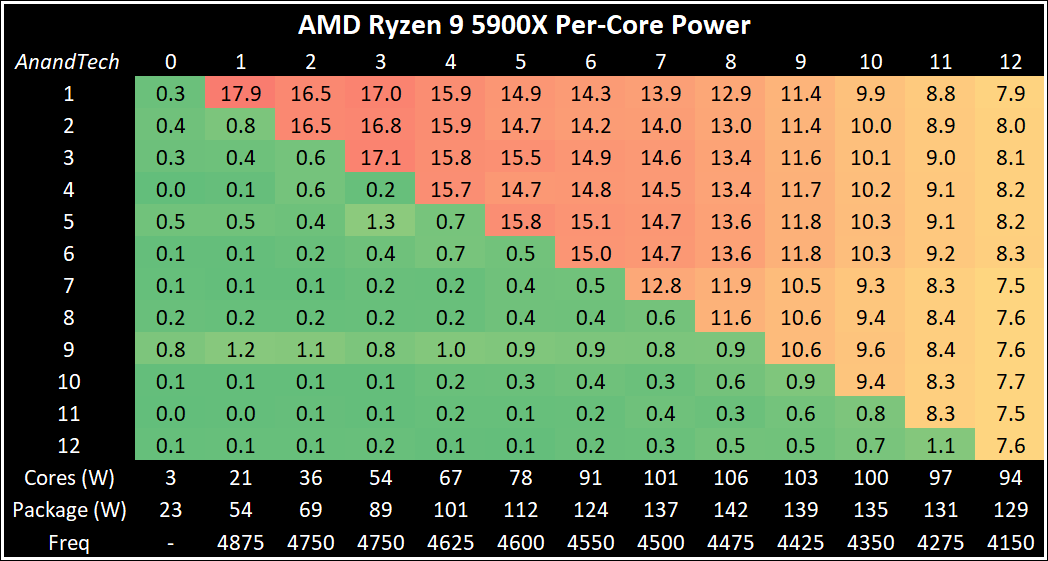
Moving down the stack, the 12-core Ryzen 9 5900X doesn’t show any surprises – we’re seeing the same drop off as we load up the cores, this time as we go beyond eight cores. As this processor uses two chiplets, each with six cores, that second set of six cores seem to be consuming lower power per core as we add in additional load.
Some users might be scratching their heads – why is the second chiplet in both of these chips using less power, and therefore being more efficient? Wouldn’t it be better to use that chiplet as the first chiplet for lower power consumption at low loads? I suspect the answer here is nuanced – this first chipet likely has cores that enable a higher leakage profile, and then could arguably hit the higher frequencies at the expense of the power.
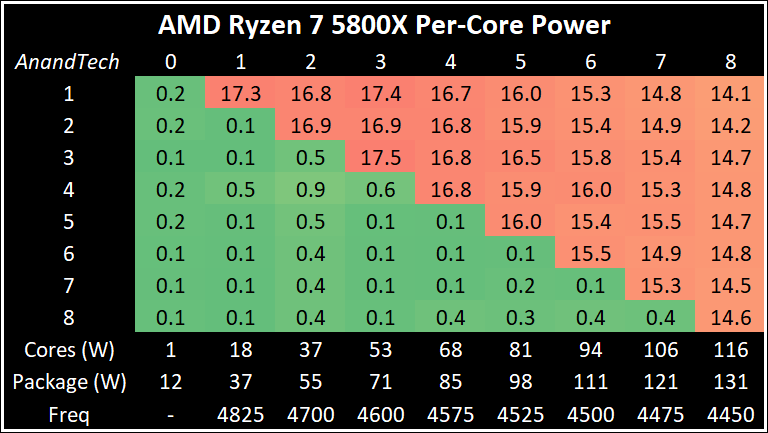
Moving down to a single chiplet but will the full power budget, and there is some power savings by not having the communications of a second chiplet. However, at 8-core load, the 5800X is showing 4450 MHz: the Ryzen 9 processors are showing 4475 MHz and 4500 MHz, indicating that there is still some product differentiation going on with this sort of performance. With this chip we still saw 140 W peak power consumption, however it wasn’t on this benchmark (our peak numbers can come from a number of benchmarks we monitor, not just our power-loading benchmark set).
At the 65 W level of the 5600X, as mentioned before, the all-core frequency is 4450 MHz, which is actually 50 MHz behind the 5800X. However this chip is very consistent, still giving up +50 MHz on its peak turbo compared to the on-box number. It also carries this turbo through to at least 3 core loading, and doesn’t lose much to 5 core loading. Users looking for something low power and consistent could be swayed by this chip.
For some specific real-world tests, we’re going to focus solely on the Ryzen 9 5950X. First up is our image-model construction workload, using our Agisoft Photoscan benchmark. This test has a number of different areas that involve single thread, multi-thread, or memory limited algorithms.
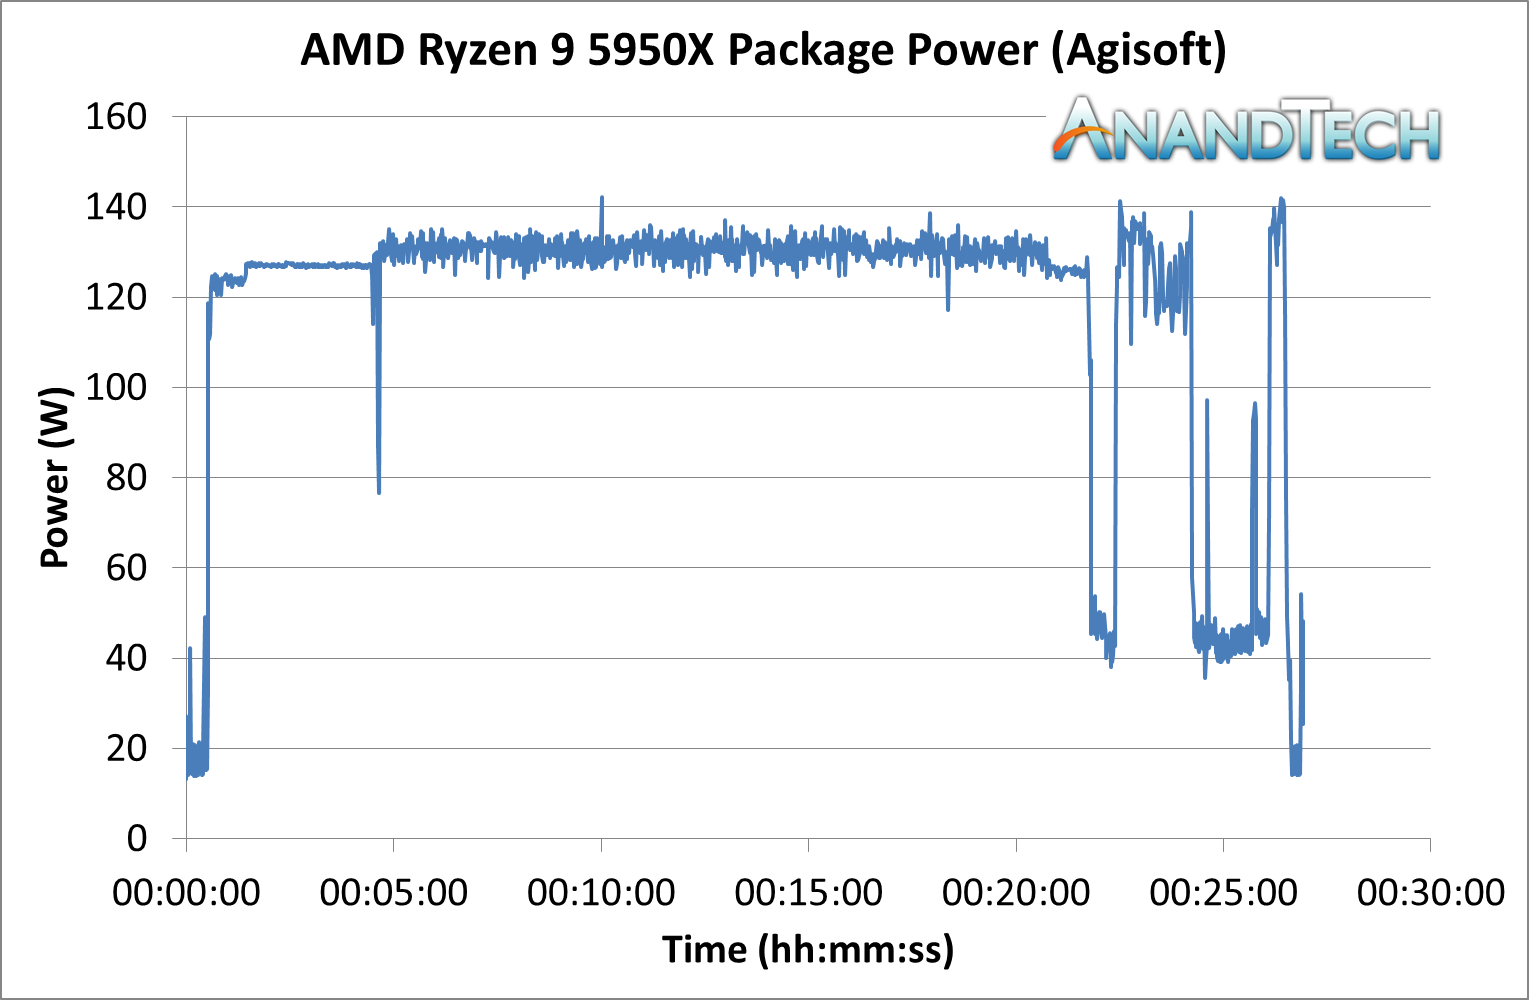
Most of this test sits around the 130 W mark, as the workload has a variable thread count. There are a couple of momentary spikes above 140 W, however everything is well within expected parameters.
The second test is from y-Cruncher, which is our AVX2/AVX512 workload. This also has some memory requirements, which can lead to periodic cycling with systems that have lower memory bandwidth per core options.
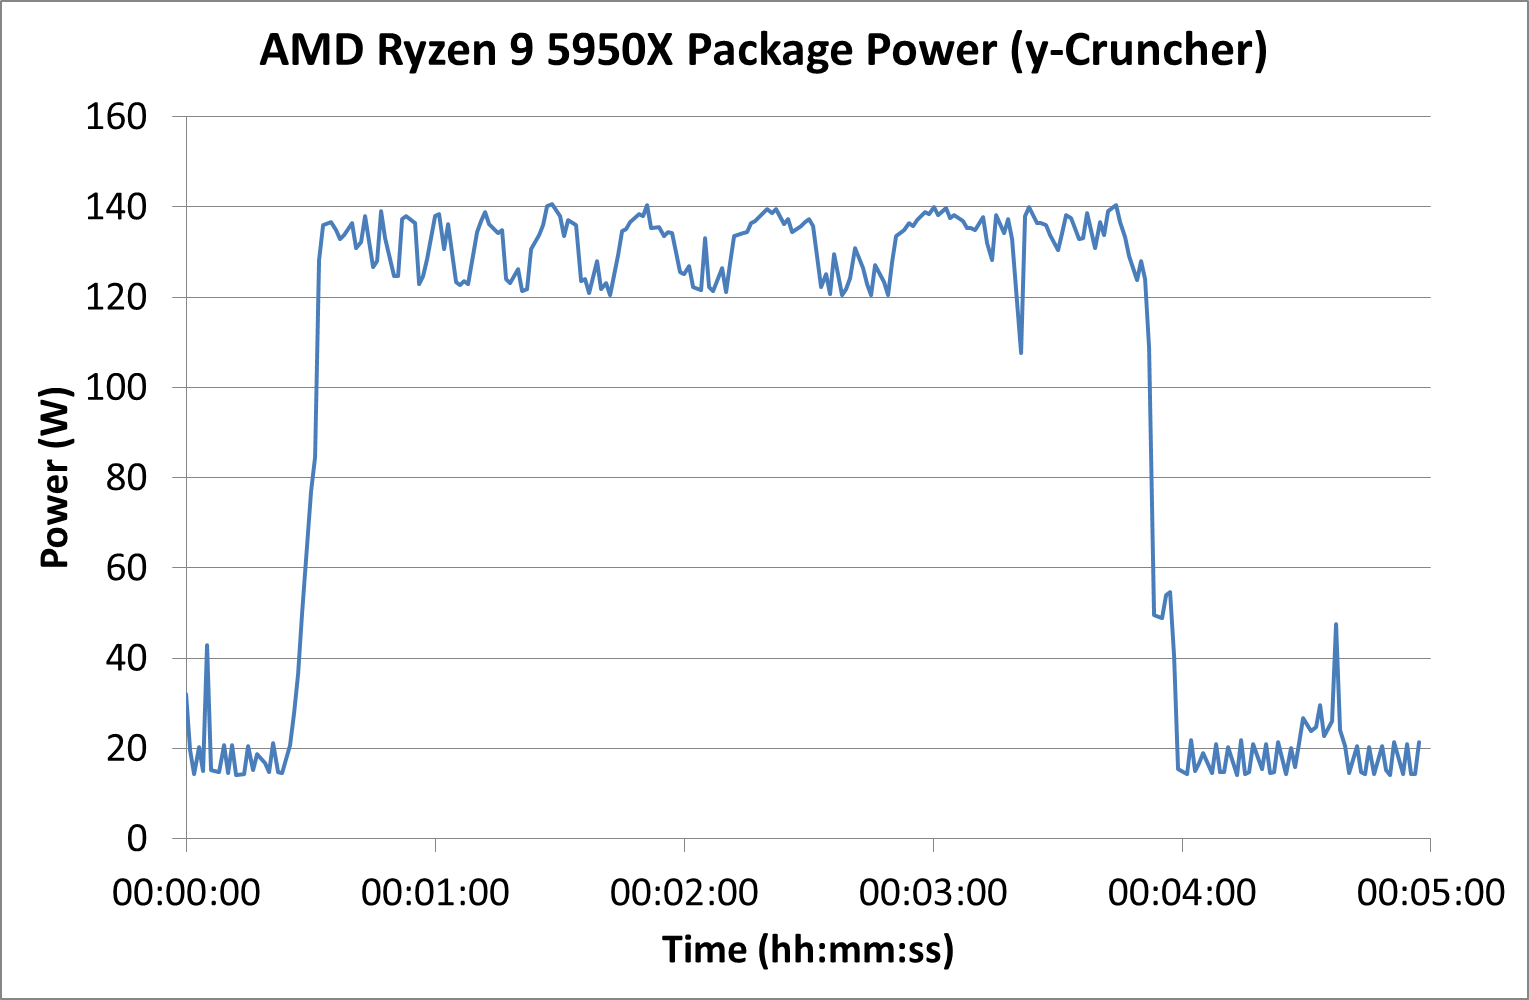
Our y-Cruncher test often shows one of two patterns – either a flat line for power-limited processors, or this zig-zag as the test is loaded and also uses a good portion of memory transfers for the calculation. Usually it is the latter which showcases when we’re getting the most out of the processor, and we get this here.
Compared to other processors, for peak power, we report the highest loaded value observed from any of our benchmark tests.
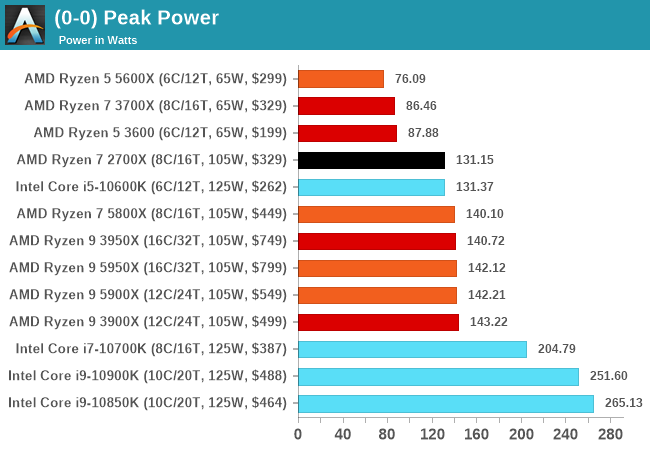
Due to AMD’s PPT implementation, we’re getting very consistent peak power results between multiple generations of AMD processors. Because OEMs play around with Intel’s turbo implementation, essentially to an unlimited peak turbo power, this is why we see full-loaded values well above 200 W. While Intel stays on its most optimized 14nm process and AMD leverages TSMC’s leading 7nm, along with multiple generations of DTCO, AMD will have that efficiency lead.


339 Comments
View All Comments
Luminar - Thursday, November 5, 2020 - link
Cache Rules Everything Around MeSIDtech - Thursday, November 5, 2020 - link
Hi Andrei,Excellent work. Do you know how this performance shapes up against the Cortex A77 ?
t.s - Friday, November 6, 2020 - link
Seconded. Want to know how the likes of ryzen 4 4350G or 5600 versus Cortex A77 or A78.Kangal - Saturday, November 7, 2020 - link
It's hard to say, because it really depends on the instruction/software as it is very situational. It also depends on the type of device it is powering, you can move up from Phones, to Thin Tablets, to Thick Laptops, to Large Desktops, and upto a Server. Each device offers different thermal constraints.The lower-thermal devices will favour the ARM chip, the mid-level will favour AMD, and the higher-thermal devices will favour Intel. That WAS the rule of thumb. In general, you could say Intel's SkyLake has the single-threaded performance crown, then AMD's Zen+ loses to it by a notable margin but beats it in multi-threaded tasks, and then going to an ARM Cortex A76 will have the lowest single-thread but the highest multi-threaded performance.
Now?
Well, there's the newly launched 2021 AMD Zen3 processor. And the upcoming 2021 ARM Cortex-X Overclocked Big-core using the new A78 microarchitecture. Lastly there's the 2022 Intel Rocket Lake yet to debut. So it's too early to tell, we can only make inferences.
Kangal - Saturday, November 7, 2020 - link
Here is my personal (yet amateur) take on the future 2020-2022 standpoints between the three racers. Firstly I'll explain what the different keywords and attributes mean(from most technical to most real-world implication)
Total efficiency: (think Full Server / Tractor) how much total calculations versus total power draw
Multi-threaded: (think Large Desktop / Truck) how much total calculations
Single-threaded: (think Thick Laptop / Car) how much priority calculations
IPC performance: (think Thin Tablet / Motorbike) how much priority calculations at desirable frequency/voltage/power-draw
*Emulating:
Having a "simple" ARM chip running "complex" x86 instructions. Such as running 32bit or 64bit OS X or Windows programs, via new techniques of emulation using a partial-hardware and hybrid-software solutions. I think the hit to efficiency will be around x3, instead of the expected x12 degradation.
So here are the lists (from most technical to most real-world implication)
Simple Code > Mixed code > Recommended Solution
Here's how they stack up when running identical new code (ie Modern Apps):
Total efficiency: ARM >>>> AMD >> Intel
Multi-threaded: ARM > AMD > Intel
Single-threaded: Intel = AMD > ARM
IPC performance: ARM >>> AMD > Intel
Now what about them running legacy code (ie x86 Program):
Efficiency + *emulating: AMD > Intel >> ARM
Multi + *emulating: AMD > Intel >> ARM
1n + *emulating: Intel = AMD >>> ARM
IPC + *emulating: AMD > Intel > ARM
My recommendation?
Full Server: 60% legacy 40% new code. This makes ARM the best option by a small margin.
Large Desktop: 80% legacy 20% new code. AMD is the best option with modest margin.
Thick Laptop: 70% legacy 30% new code. Intel is the best. AMD is very close (tied?) second.
Thin Tablet: 10% legacy 90% new code. ARM is the best option by huge margin.
Tomatotech - Monday, November 9, 2020 - link
Excellent post, but worth pointing out that *all* modern chips now emulate x86 and x64 code. They run a front end that takes x86 / x64 machine code then convert that into RISC code and that goes through various microcode and translation layers before being processed by the backend. That black box structure has allowed swapping out and optimising the back end for decades while maintaining code compatibility on the front end.So it’s not as simple to differentiate between the various chips as you make it out to be.
Gondalf - Sunday, November 8, 2020 - link
I don't know. Looking Spec results, we can say Anandtech is absolutely unable to set a Spec session correctly. From the review Zen 2 is slower per Ghz than old Skylake in integer, that is absolutely wrong in consumer cores (in server cores yes), even worse Ice Lake core is around fast as old Skylake per GHz.Basically this review is rushed and very likely they have set all AMD compiler flags on "fast" to do more contacts and a lot of hipe.
My God, for Anandtech Zen 3 is 35% faster in the global Spec values than Zen 2. Not even AMD worst marketing slide say this. We have Zen 4 here not Zen 3. Wait wait please.
A really crap review, the author need to go back to school about Spec.
Obviously the article do not say that 28W Tiger Lake is unable to run at 4.8Ghz for more than a couple of seconds, after this it throttes down, so the same Willow Cove core on a desktop Cpu could destroy Zen 3 without mercy on a CB session. Not to mention the far slower memory subsystem of a mobile cpu.
Basically looking at games results, Rocket Lake will eclipse this core forever. AMD have nothing of new in its hands, they need to wait Zen 4
Qasar - Sunday, November 8, 2020 - link
yea ok gondalf, trying to find ways that your beloved intel doesnt lose at everything now ??accept it, amd is faster then intel across the board.
Spunjji - Monday, November 9, 2020 - link
That's a strange claim about Tiger Lake performance, Gondalf, because I seem to recall Intel seeding all the reviewers with a laptop that could run TGL at 4.8Ghz boost 'til the cows come home - and that's what Anandtech used to get that number. It's literally the best they can do right now. You're right of course - in actual shipping ultrabooks, TGL is a hot PoS that cannot maintain its boost clocks. Maybe by 2022 they'll finally put Willow Cove into a shipping desktop CPU."Basically looking at games results, Rocket Lake will eclipse this core forever"
If by "eclipse" you mean gain a maximum 5% advantage at higher clock speeds and nearly double the power draw then sure, "eclipse", yeah. 🤭
I love your posts here. Please, never stop stepping on rakes like Sideshow Bob.
macroboy - Saturday, December 12, 2020 - link
LOL look at AMD's Efficiency and sustained core clocks, Intel runs too hot to stay at 5ghz for very long. meanwhile Zen3 plows along at 55C no problem, *you're the one who needs to check your facts.