QLC Goes To 8TB: Samsung 870 QVO and Sabrent Rocket Q 8TB SSDs Reviewed
by Billy Tallis on December 4, 2020 8:00 AM ESTPower Management Features
Real-world client storage workloads leave SSDs idle most of the time, so the active power measurements presented earlier in this review only account for a small part of what determines a drive's suitability for battery-powered use. Especially under light use, the power efficiency of a SSD is determined mostly be how well it can save power when idle.
For many NVMe SSDs, the closely related matter of thermal management can also be important. M.2 SSDs can concentrate a lot of power in a very small space. They may also be used in locations with high ambient temperatures and poor cooling, such as tucked under a GPU on a desktop motherboard, or in a poorly-ventilated notebook.
| Sabrent Rocket Q 8TB NVMe Power and Thermal Management Features |
|||
| Controller | Phison E12S | ||
| Firmware | RKT30Q.2 (ECFM52.2) | ||
| NVMe Version |
Feature | Status | |
| 1.0 | Number of operational (active) power states | 3 | |
| 1.1 | Number of non-operational (idle) power states | 2 | |
| Autonomous Power State Transition (APST) | Supported | ||
| 1.2 | Warning Temperature | 75°C | |
| Critical Temperature | 80°C | ||
| 1.3 | Host Controlled Thermal Management | Supported | |
| Non-Operational Power State Permissive Mode | Supported | ||
The Sabrent Rocket Q claims support for the full range of NVMe power and thermal management features. However, the table of power states includes frighteningly high maximum power draw numbers for the active power states—over 17 W is really pushing it for a M.2 drive. Fortunately, we never measured consumption getting that high. The idle power states look typical, including the promise of quick transitions in and out of idle.
| Sabrent Rocket Q 8TB NVMe Power States |
|||||
| Controller | Phison E12S | ||||
| Firmware | RKT30Q.2 (ECFM52.2) | ||||
| Power State |
Maximum Power |
Active/Idle | Entry Latency |
Exit Latency |
|
| PS 0 | 17.18 W | Active | - | - | |
| PS 1 | 10.58 W | Active | - | - | |
| PS 2 | 7.28 W | Active | - | - | |
| PS 3 | 49 mW | Idle | 2 ms | 2 ms | |
| PS 4 | 1.8 mW | Idle | 25 ms | 25 ms | |
Note that the above tables reflect only the information provided by the drive to the OS. The power and latency numbers are often very conservative estimates, but they are what the OS uses to determine which idle states to use and how long to wait before dropping to a deeper idle state.
Idle Power Measurement
SATA SSDs are tested with SATA link power management disabled to measure their active idle power draw, and with it enabled for the deeper idle power consumption score and the idle wake-up latency test. Our testbed, like any ordinary desktop system, cannot trigger the deepest DevSleep idle state.
Idle power management for NVMe SSDs is far more complicated than for SATA SSDs. NVMe SSDs can support several different idle power states, and through the Autonomous Power State Transition (APST) feature the operating system can set a drive's policy for when to drop down to a lower power state. There is typically a tradeoff in that lower-power states take longer to enter and wake up from, so the choice about what power states to use may differ for desktop and notebooks, and depending on which NVMe driver is in use. Additionally, there are multiple degrees of PCIe link power savings possible through Active State Power Management (APSM).
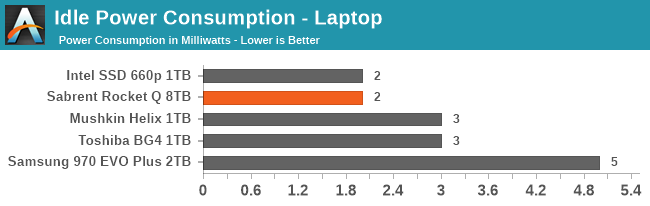
We report three idle power measurements. Active idle is representative of a typical desktop, where none of the advanced PCIe link power saving features are enabled and the drive is immediately ready to process new commands. Our Desktop Idle number represents what can usually be expected from a desktop system that is configured to enable SATA link power management, PCIe ASPM and NVMe APST, but where the lowest PCIe L1.2 link power states are not available. The Laptop Idle number represents the maximum power savings possible with all the NVMe and PCIe power management features in use—usually the default for a battery-powered system but not always achievable on a desktop even after changing BIOS and OS settings. Since we don't have a way to enable SATA DevSleep on any of our testbeds, SATA drives are omitted from the Laptop Idle charts.
Note: Last year we upgraded our power measurement equipment and switched to measuring idle power on our Coffee Lake desktop, our first SSD testbed to have fully-functional PCIe power management. The below measurements are not a perfect match for the older measurements in our reviews from before that switch.
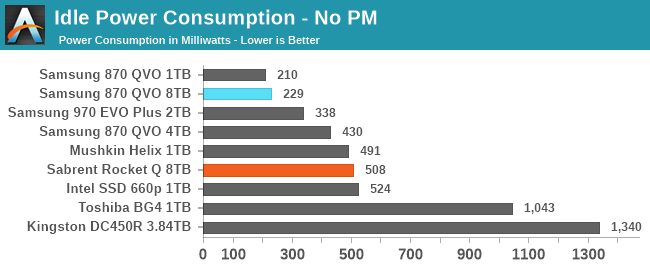
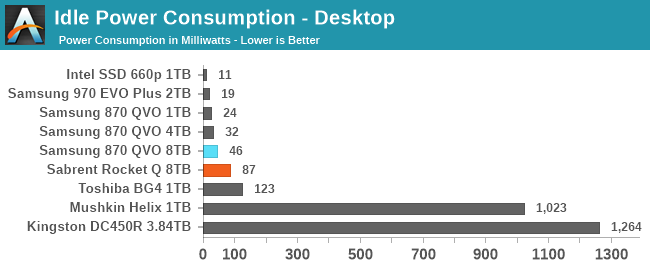
The Samsung 870 QVO SSDs have lower active idle power consumption than the NVMe competition, though our measurements of the 4TB model did catch it while it was still doing some background work. With SATA link power management enabled the 8TB 870 QVO draws more power than the smaller models, but is still very reasonable.
The Sabrent Rocket Q's idle power numbers are all decent but not surprising. The desktop idle power draw is significantly higher than the 49mW the drive claims for power state 3, but it's still only at 87mW which is not a problem.
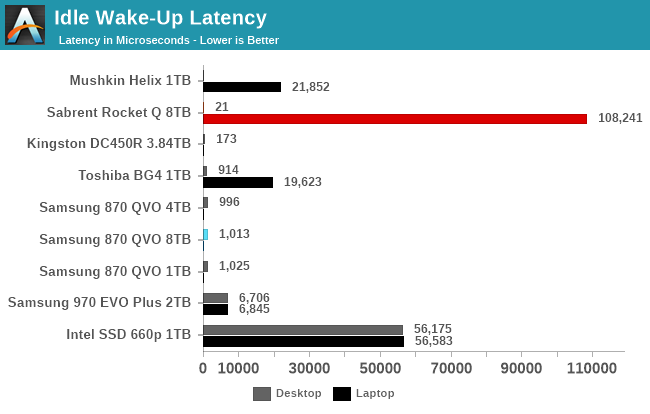
The Samsung 870 QVO takes 1ms to wake up from sleep. The Sabrent Rocket Q has almost no measurable wake-up latency from the intermediate desktop idle state, but takes a remarkably long 108ms to wake up from the deepest sleep state. This is one of the slowest wake-up times we've measured from a NVMe drive and considerably worse than the 25ms latency the drive itself promises to the OS.


150 Comments
View All Comments
heffeque - Friday, December 4, 2020 - link
No worries on a NAS: BTRFS will take care of that in the background.Billy Tallis - Friday, December 4, 2020 - link
Not sure if that's a joke about BTRFS RAID5/6 ensuring you lose your data.A BTRFS scrub isn't automatic; you need a cron job or similar to automate periodic scrubbing. But assuming you do that and stay away from the more dangerous/less tested RAID modes, you shouldn't have to worry about silent data loss. I've been using BTRFS RAID1 with various SSDs as my primary NAS ever since I amassed enough 1 and 2TB models, and it's worked well so far. ZFS would also work reasonably well, but it is less convenient when you're using a pile of mismatched drives.
Getting back to the question of data retention of QLC itself: the write endurance rating of a drive is supposed to be chosen so that at the end of the rated write endurance the NAND is still healthy enough to provide 1 year unpowered data retention. (For client/consumer drives; for enterprise drives the standard is just 3 months, so they can afford to wear out the NAND a bit further, and that's part of why enterprise drives have higher TBW ratings.)
heffeque - Wednesday, December 9, 2020 - link
BTRFS background self-healing is automatic in Synology as of DSM 6.1 and above.TheinsanegamerN - Saturday, December 5, 2020 - link
Long term cold storage of any flash memory is terrible. QLC wont be any better then TLC in this regard.Oxford Guy - Sunday, December 6, 2020 - link
How could it possibly be better (than 3D TLC)?It can only be worse unless the TLC is really shoddy quality. This is because it has 16 voltage states rather than 8.
TheinsanegamerN - Monday, December 7, 2020 - link
Hence why I said it wont be any better, because it cant be. That leaves the door open for it to be worse.Reeding iz hard.
Oxford Guy - Monday, December 7, 2020 - link
But your comment obviously wasn't clear enough, was it?QLC is worse than TLC. Next time write that since that's the clear truth, not that QLC and TLC are somehow equivalent.
joesiv - Friday, December 4, 2020 - link
I love the idea of 8TB SSD drives, it's the perfect size for a local data drive, I could finally be rid of my spinning rust! Just need the price to drop a bit, maybe next year!Thank you for the review. Though I wish reviews of SSD's would be more clear to consumers what endurance really means to the end user. "DWPD" and TB/D, are mentioned, noone seems to highlight the fact that, it's not end user's writes that matter in these specifications, it's "writes to nand", which can be totally different from user/OS writes. It is reliant on the firmware, and some firmwares do some wonky things for data collection, speed, or even have bugs, which drastically drop the endurance of a drive.
Of course I would love an exhaustive endrance test in the review, at the bare minimum, if anandtech could check the smart data after the benchmark is done, and verify two things, it would give you some useful information.
Check:
- nand writes (average block erases is usually available)
- OS writes (sometimes is not easily available), but since you run a standardized bench suite, perhaps you have an idea of how many GB's you typically run through your drives anyways.
You might need to do a bit of math on the block erase count, to get it back to GBs, and you might need to contact the manufacturer for SMART data attribute documentation, but if they don't have good smart data attributes, or documentation available, perhaps it's something to highlight in the review.
But then you could weed out, and present to the consumer drives that have firmwares have outrageously inefficient nand write patterns.
My company has had several failures, and because of that, have had to test in this way potential drives for our products, and have had to outright skip drives that's specs were great, but the firmwares were doing very inefficient drive writes, limiting their endurance.
anyways, feedback, and fingers crossed!
Keep up the good work, and thanks for the quality content!
heffeque - Friday, December 4, 2020 - link
Well... 2 TB per day every day seems like a lot of writes. Not sure it'll be a problem for normal use.joesiv - Friday, December 4, 2020 - link
well firmware bugs can cause writes to be magnified 10x, 100x higher than what is expected. I've seen it. So, you're 2TB's, would just be 20GB's... Of course we hope that firmwares don't have such bugs, but how would we know unless someone looked at the numbers?