QLC Goes To 8TB: Samsung 870 QVO and Sabrent Rocket Q 8TB SSDs Reviewed
by Billy Tallis on December 4, 2020 8:00 AM ESTSequential Read Performance
Our first test of sequential read performance uses short bursts of 128MB, issued as 128kB operations with no queuing. The test averages performance across eight bursts for a total of 1GB of data transferred from a drive containing 16GB of data. Between each burst the drive is given enough idle time to keep the overall duty cycle at 20%.
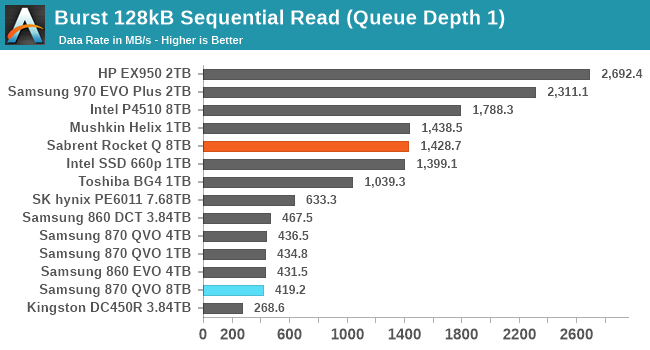
Both of the 8TB QLC SSDs provide burst sequential read performance that is on par for their respective market segments. The Sabrent Rocket Q performs similarly to both the Mushkin Helix DRAMless TLC and Intel 660p QLC SSDs. The 8TB Samsung 870 QVO is just a bit slower than the other Samsung SATA SSDs.
Our test of sustained sequential reads uses queue depths from 1 to 32, with the performance and power scores computed as the average of QD1, QD2 and QD4. Each queue depth is tested for up to one minute or 32GB transferred, from a drive containing 64GB of data. This test is run twice: once with the drive prepared by sequentially writing the test data, and again after the random write test has mixed things up, causing fragmentation inside the SSD that isn't visible to the OS. These two scores represent the two extremes of how the drive would perform under real-world usage, where wear leveling and modifications to some existing data will create some internal fragmentation that degrades performance, but usually not to the extent shown here.
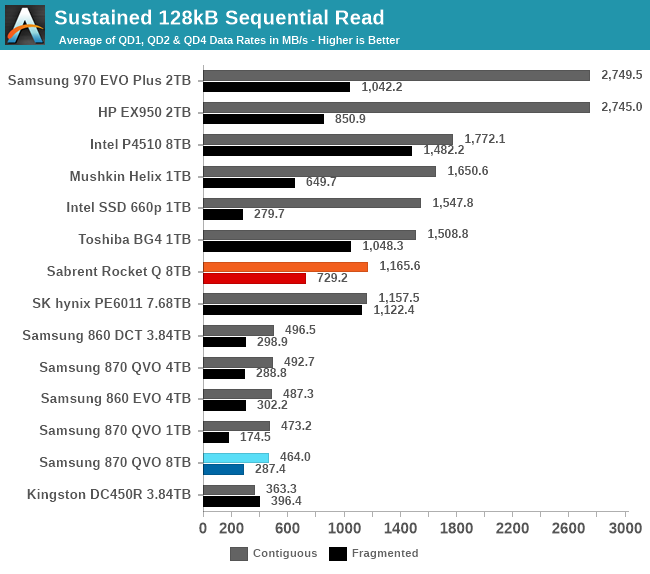
On the longer sequential read tests, the Sabrent Rocket Q starts to fall behind the other low-end NVMe drives, though it still offers competitive performance reading data that was written with random writes. The Samsung 870 QVO holds on to its status as only slightly slower than the other Samsung SATA drives, but due to the SATA bottleneck this is still far slower than any of the NVMe drives.
 |
|||||||||
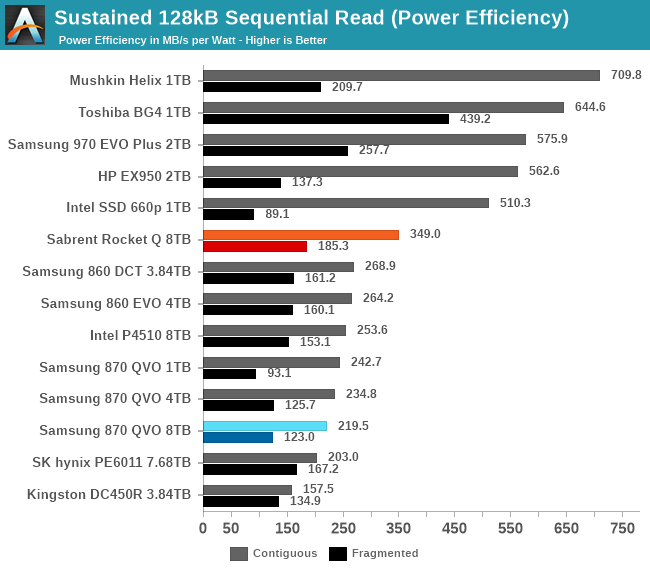
| Power Efficiency in MB/s/W | Average Power in W | ||||||||
The Sabrent Rocket Q is clearly the least efficient consumer NVMe drive in this bunch for sequential reads of contiguous data; the DRAMless TLC drives outperform it while using much less power, and the more power-hungry high-end TLC SSDs have higher performance to match. The 8TB Samsung 870 QVO again scores just a bit worse than its lower-capacity siblings, because the 8TB model is slightly slower and draws slightly more power.
 |
|||||||||
Like many Phison-based NVMe SSDs, the Sabrent Rocket Q's sequential read performance doesn't really begin to scale up until queue depths go beyond 4, explaining its poor low-QD scores above. By QD16 it is basically saturating the PCIe 3 x4 interface. The Samsung 870 QVO saturates the SATA interface starting at QD2.
 |
|||||||||
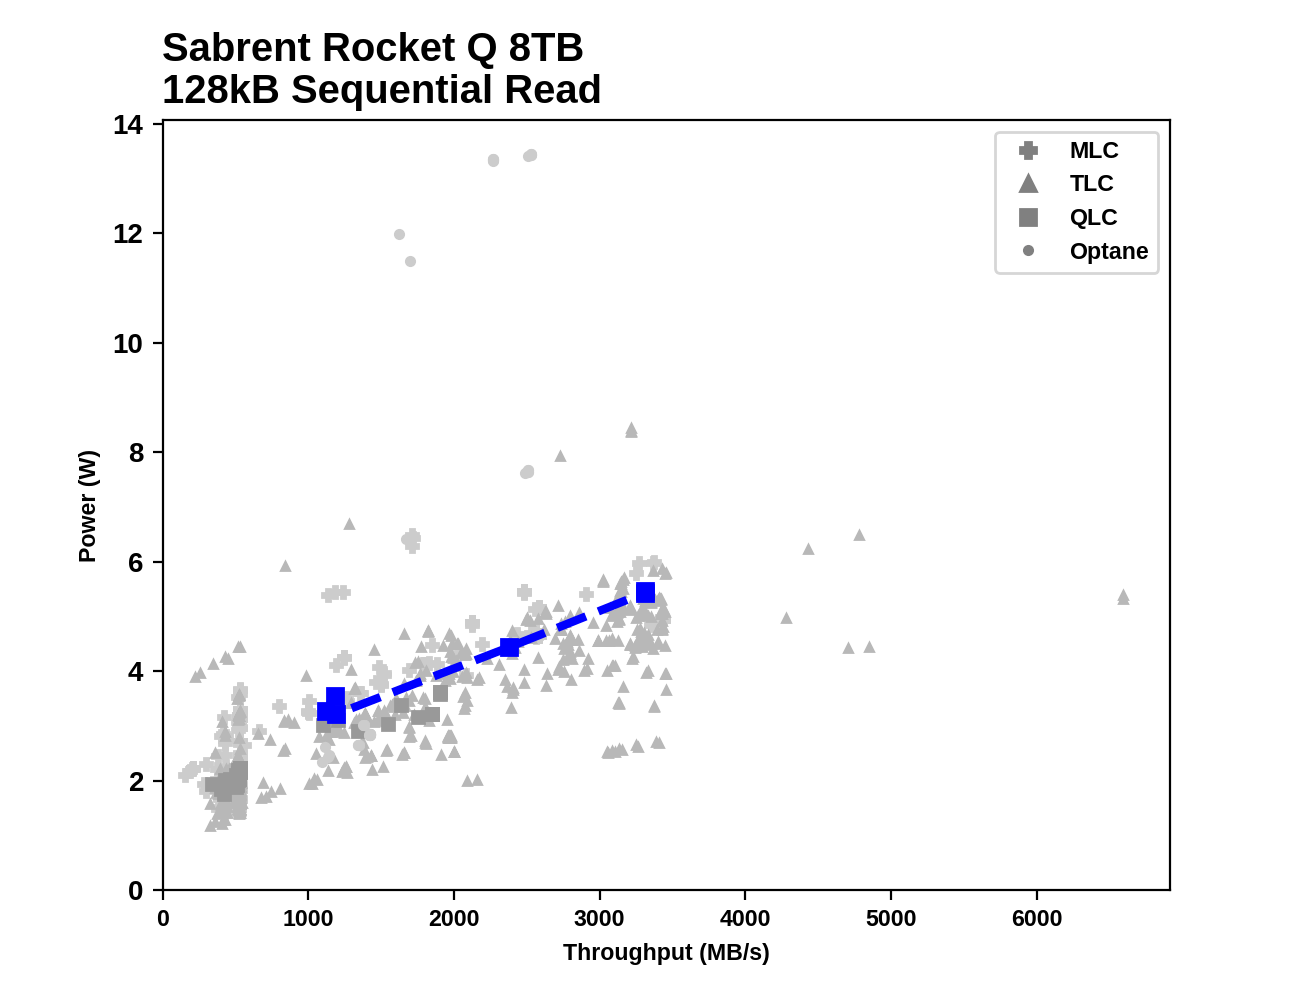
| Sabrent Rocket Q 8TB | Samsung 870 QVO 8TB | ||||||||
While both 8TB drives saturate their respective host interfaces with sequential reads when the queue depths are sufficiently high, they also both draw more power than average among our entire collection of test results. However, neither is power-hungry enough to stand out as an outlier from that crowd.
Sequential Write Performance
Our test of sequential write burst performance is structured identically to the sequential read burst performance test save for the direction of the data transfer. Each burst writes 128MB as 128kB operations issued at QD1, for a total of 1GB of data written to a drive containing 16GB of data.
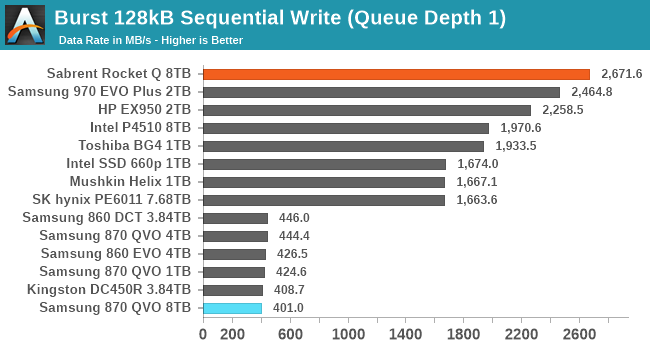
The burst sequential write test primarily illustrates SLC cache performance, and the Sabrent Rocket Q does quite well here, outperforming the rest of the NVMe drives in this bunch. The 8TB Samsung 870 QVO is the slowest drive, but is only slightly slower than the other SATA drives.
Our test of sustained sequential writes is structured identically to our sustained sequential read test, save for the direction of the data transfers. Queue depths range from 1 to 32 and each queue depth is tested for up to one minute or 32GB, followed by up to one minute of idle time for the drive to cool off and perform garbage collection. The test is confined to a 64GB span of the drive.
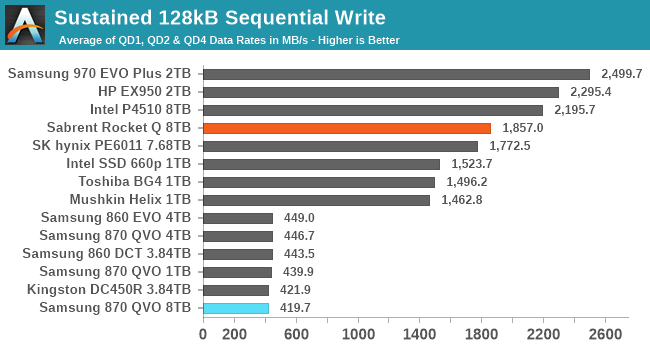
On the longer sequential write test, the Rocket Q falls behind the high-end consumer NVMe drives but remains clearly faster than the other budget NVMe drives. Meanwhile, the 8TB 870 QVO stays in last place, but is not actually meaningfully slower than the other SATA drives.
 |
|||||||||
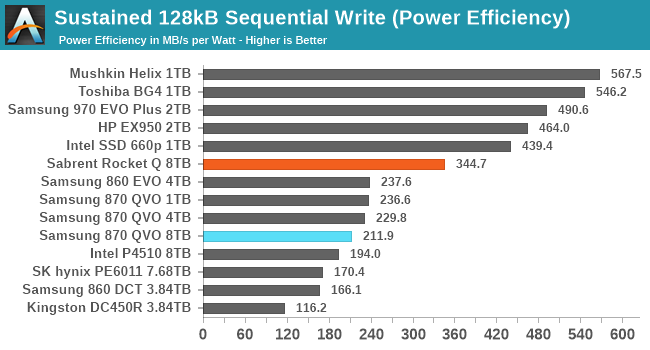
| Power Efficiency in MB/s/W | Average Power in W | ||||||||
The Sabrent Rocket Q has the worst power efficiency among the consumer NVMe drives during the sequential write test, but it still offers better performance per Watt than the SATA drives. The 8TB 870 QVO has a lower efficiency score than the other consumer SATA drives, but the enterprise drives are even worse.
 |
|||||||||
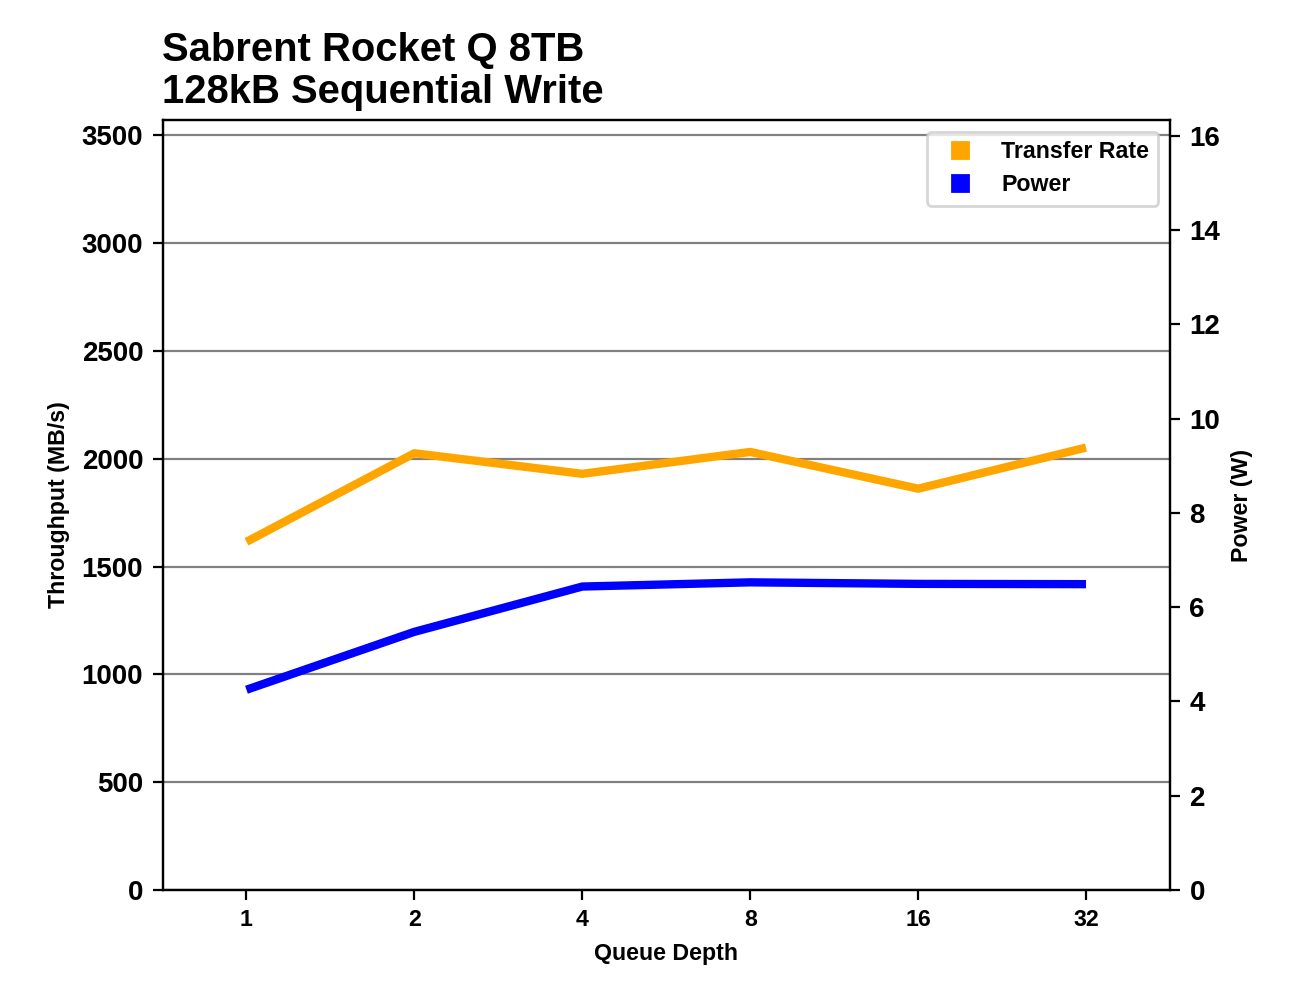
Both of the 8TB QLC drives hit their full sequential write speed at QD2 and maintain it for the rest of the test without the SLC cache running out. However, the performance from the Rocket Q is a somewhat variable, probably indicating that it is affected by background work the controller is doing to flush the SLC cache.
 |
|||||||||
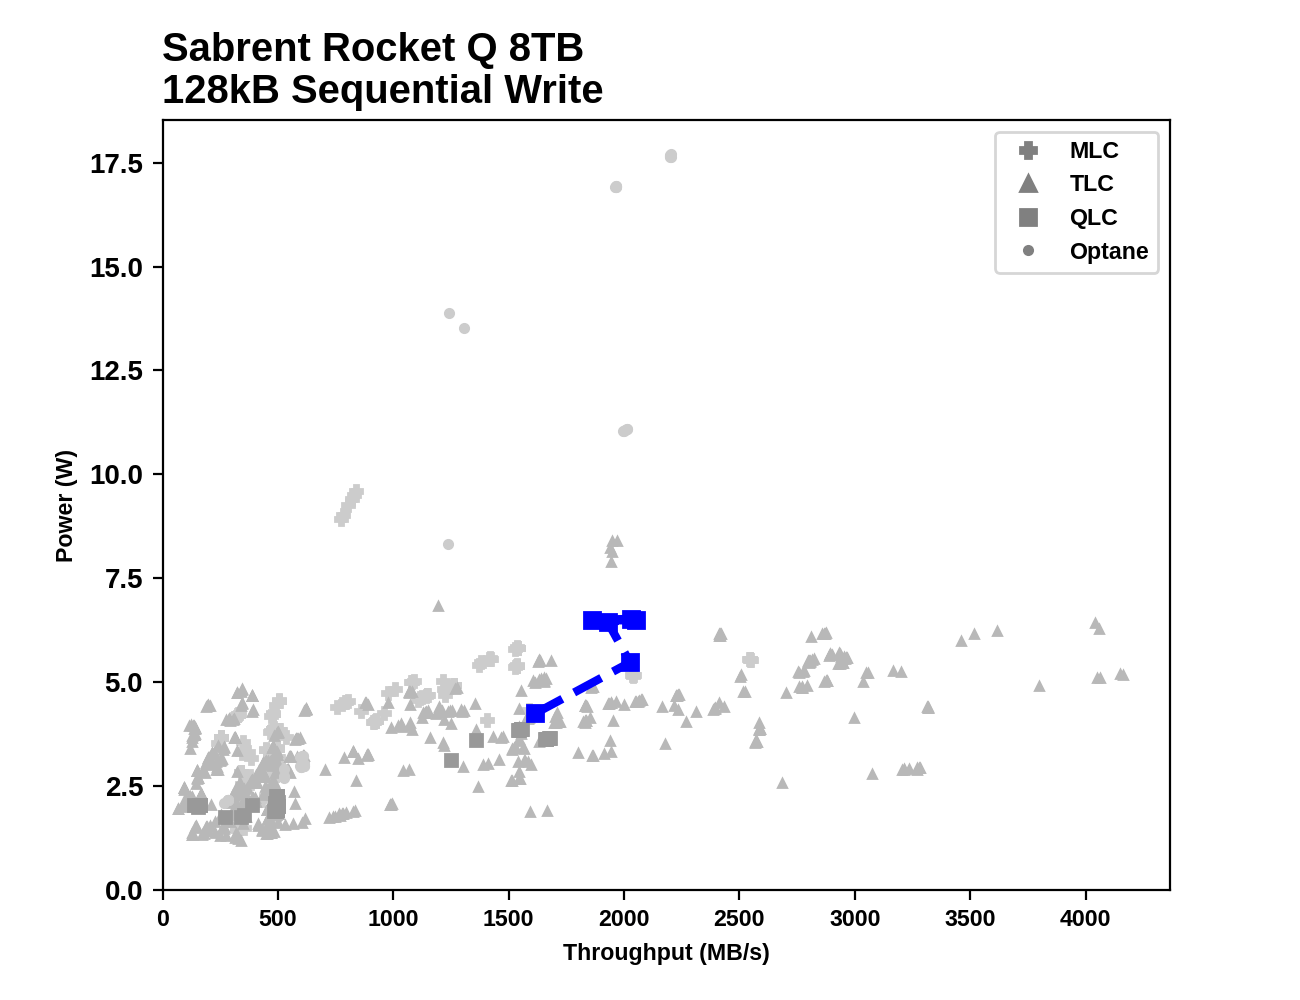
| Sabrent Rocket Q 8TB | Samsung 870 QVO 8TB | ||||||||
Plotted against the full set of results from all the SATA SSDs we've tested, the performance and power consumption of the 8TB 870 QVO on the sequential write test appears to be good but not pushing any limits. The Rocket Q's performance is higher than most entry-level NVMe drives, but its power consumption creeps up to unusually high levels (over 6W).


150 Comments
View All Comments
TheinsanegamerN - Monday, December 7, 2020 - link
"50% of people know what QLC means? Is that a joke? 50% of ATers don't understand what that means"Care to back up your staement with evidence? AT is mostly perused by techie people who understand the difference between SLC, MLC, TLC, and QLC.
at_clucks - Wednesday, December 9, 2020 - link
@TheinsanegamerN, yeah, you're swimming in the evidence. Check out the comment section carefully and you'll see how well the average ATer understands this. Some may know something about "bits per cell, whatever that means", some may know it's less reliable because "it wears out faster whatever that means", so they know the marketing concepts but not what lies underneath them. Most will blindly assume SLC > MLC > TLC > QLC not why or how, not what the cell is, how it works, how many levels of charge it can have, how it's read or how it's written, how they're organized, not the impact of the implementation, controller, firmware, OS, not why exactly wear is a thing, not why writes wear the cell but reads aren't an issue, not what planar/2D vs. 3D means, etc. Being a "techie" today means you *buy* a lot of tech and gloss over some articles with bar charts of which product is faster. That's it.If you want me to give "evidence" of every statement I make prepare to provide answers that have enough references in the footnote to look like a PhD thesis.
In the meantime it's all but guaranteed that a regular consumer has no clue what QLC means or that the product name is a reference to QLC. They see an SSD that fits their computer, has a certain capacity, and costs a certain price. Maybe the manufacturer on the label alleviates their concerns.
Knowing QLC has less endurance than SLC ("wears out") or that this is slower than that doesn't mean you understand the tech more than knowing some cars drive faster than others or have lower safety ratings makes you a piston head or mechanic.
ripbeefbone - Friday, December 11, 2020 - link
you're way too onlineOxford Guy - Sunday, December 6, 2020 - link
In large part because product pushers like slickdeals don't list the type of NAND in the listing title.This is the opposite of how manufacturers wanted to use LED to push TV sales so LED was always listed in product listings.
People become aware of what manufacturers want them to become aware of. That's why we have so many marketing programs generating graduates all over the world.
Samus - Sunday, December 6, 2020 - link
Fortunately we know, and we know to stay away from this crap at this price. An 8TB 870 EVO is "worth" $600 to me and that's all I'm willing to pay for a drive that should logically cost much less than 8x1TB SSD's, not the SAME EXACT PRICE at 8x1TB SSD's (the 870 QVO 1TB regularly sells for $80-$90, and is currently $90 at Best Buy.Using Samsung's metric to scale, an 8TB hard drive should cost $400. The controller, DRAM and overall package are the same between drives. The only difference is platters\NAND.
Oxford Guy - Tuesday, December 8, 2020 - link
We knowing is irrelevant because consumer ignorance working in manufacturers’ favor is about the bulk of consumer demand not a small number of people who make extra effort to learn specs manufacturers don’t want us to know about and therefore choose to not push.Oxford Guy - Sunday, December 6, 2020 - link
"Every one of those deals has people saying no to QLC."Apples and oranges. The listing titles don't list the type of NAND.
Oxford Guy - Sunday, December 6, 2020 - link
There is also the trick of them calling TLC and QLC "MLC". Technically, it is multi-layer NAND so they can get away with it, even though it is completely shady.shabby - Sunday, December 6, 2020 - link
First company to do that will be stoned to death.Samus - Monday, December 7, 2020 - link
Do you really think the 860 EVO is MLC like it is advertised as? No, “3-bit” VNAND or more commonly known as TLC. Samsung has been calling TLC [MLC] for years and has it been stoned to death yet.