USB 3.2 Gen 2x2 State of the Ecosystem Review: Where Does 20Gbps USB Stand in 2020?
by Ganesh T S on October 5, 2020 10:30 AM EST- Posted in
- Storage
- SSDs
- Western Digital
- SanDisk
- ASMedia
- USB 3.2 Gen 2x2
PCMark 10 Storage Bench - Real-World Access Traces
There are a number of storage benchmarks that can subject a device to artificial access traces by varying the mix of reads and writes, the access block sizes, and the queue depth / number of outstanding data requests. We saw results from two popular ones - ATTO, and CrystalDiskMark - in a previous section. More serious benchmarks, however, actually replicate access traces from real-world workloads to determine the suitability of a particular device for a particular workload. Real-world access traces may be used for simulating the behavior of computing activities that are limited by storage performance. Examples include booting an operating system or loading a particular game from the disk.
PCMark 10's storage bench (introduced in v2.1.2153) includes four storage benchmarks that use relevant real-world traces from popular applications and common tasks to fully test the performance of the latest modern drives:
- The Full System Drive Benchmark uses a wide-ranging set of real-world traces from popular applications and common tasks to fully test the performance of the fastest modern drives. It involves a total of 204 GB of write traffic.
- The Quick System Drive Benchmark is a shorter test with a smaller set of less demanding real-world traces. It subjects the device to 23 GB of writes.
- The Data Drive Benchmark is designed to test drives that are used for storing files rather than applications. These typically include NAS drives, USB sticks, memory cards, and other external storage devices. The device is subjected to 15 GB of writes.
- The Drive Performance Consistency Test is a long-running and extremely demanding test with a heavy, continuous load for expert users. In-depth reporting shows how the performance of the drive varies under different conditions. This writes more than 23 TB of data to the drive.
Despite the data drive benchmark appearing most suitable for testing direct-attached storage, we opted to run the full system drive benchmark as part of our evaluation flow. Many of us use portable flash drives as boot drives and storage for Steam games. These types of use-cases are addressed only in the full system drive benchmark.
The Full System Drive Benchmark comprises of 23 different traces. For the purpose of presenting results, we classify them under five different categories:
- Boot: Replay of storage access trace recorded while booting Windows 10
- Creative: Replay of storage access traces recorded during the start up and usage of Adobe applications such as Acrobat, After Effects, Illustrator, Premiere Pro, Lightroom, and Photoshop.
- Office: Replay of storage access traces recorded during the usage of Microsoft Office applications such as Excel and Powerpoint.
- Gaming: Replay of storage access traces recorded during the start up of games such as Battlefield V, Call of Duty Black Ops 4, and Overwatch.
- File Transfers: Replay of storage access traces (Write-Only, Read-Write, and Read-Only) recorded during the transfer of data such as ISOs and photographs.
PCMark 10 also generates an overall score, bandwidth, and average latency number for quick comparison of different drives. The sub-sections in the rest of the page reference the access traces specified in the PCMark 10 Technical Guide.
Booting Windows 10
The read-write bandwidth recorded for each drive in the boo access trace is presented below.
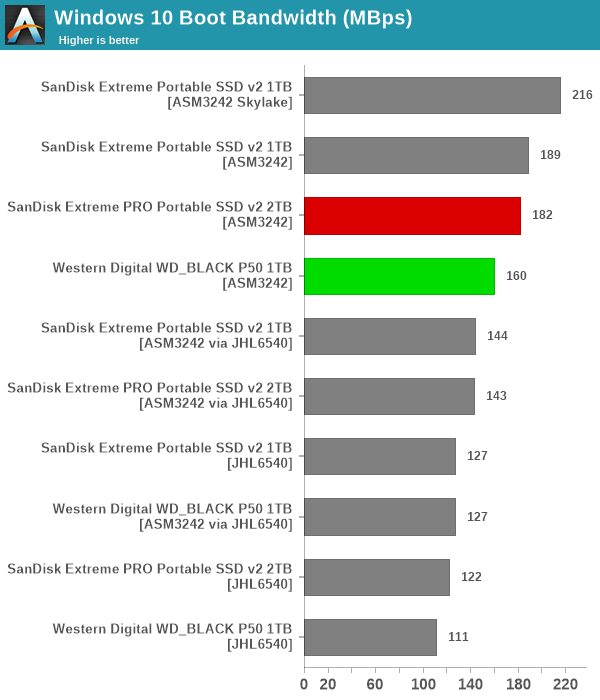
USB SuperSpeed 20Gbps doesn't matter for the boot process - in fact, the Extreme Portable SSD v2 using the SN550E behind a USB 3.2 Gen 2 (10 Gbps) bridge scores better than the P50 and the Extreme PRO v2 on the Haswell testbed in this benchmark.
Creative Workloads
The read-write bandwidth recorded for each drive in the sacr, saft, sill, spre, slig, sps, aft, exc, ill, ind, psh, and psl access traces are presented below.
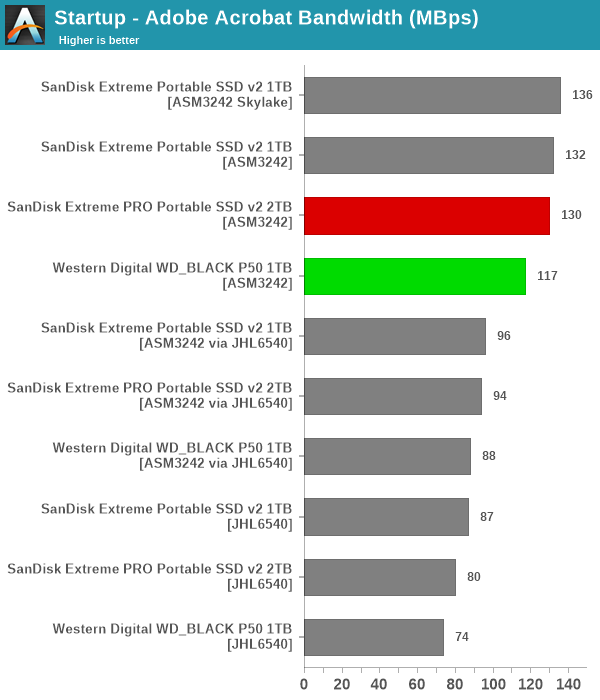
These workloads also seem to get little benefit from the move to USB SuperSpeed 20Gbps. In almost all cases, the SanDisk Extreme v2 performs better than the Extreme PRO v2 on the same testbed. The P50 seems to suffer from some handicaps for these types of workloads.
Office Workloads
The read-write bandwidth recorded for each drive in the exc and pow access traces are presented below.
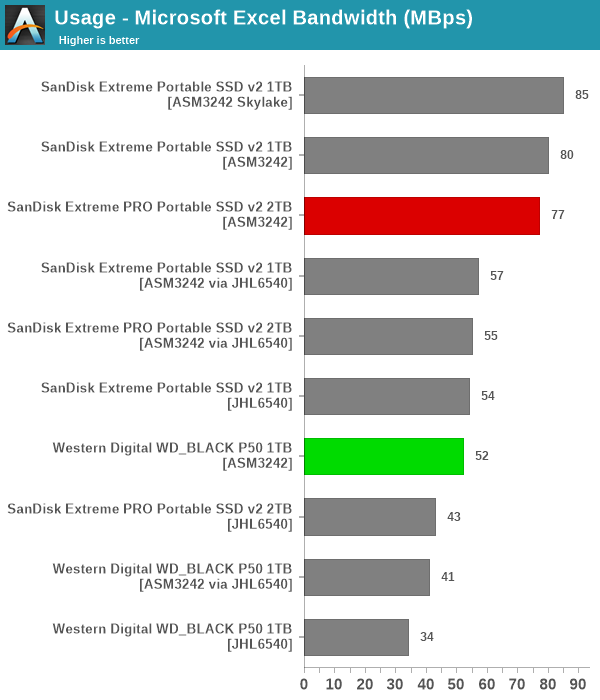
The trend seen in earlier PCMark 10 storage workloads repeats here - the Extreme edging out the Extreme PRO v2 slightly, while the P50 lags well behind.
Gaming Workloads
The read-write bandwidth recorded for each drive in the bf, cod, and ow access traces are presented below.
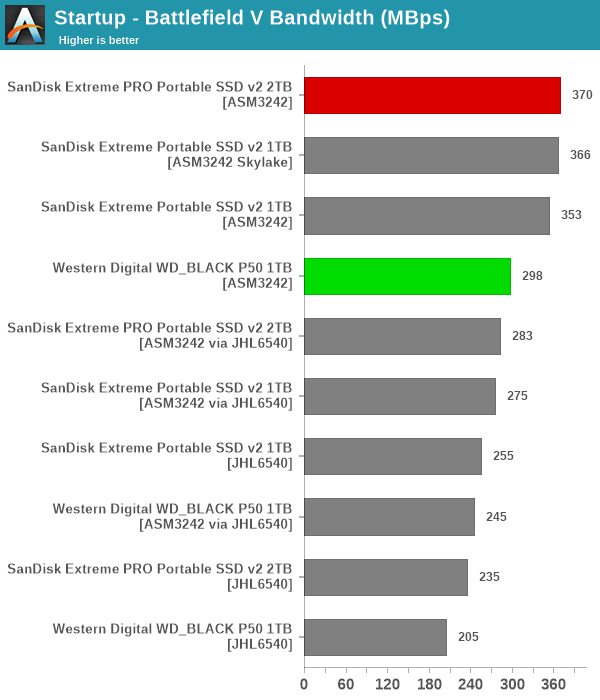
This section finally sees the P50 live up to its billing as a game drive - in the Call of Duty loading times, it finally scores almost as well as the Extreme PRO v2, and the Extreme v2 lags well behind. However, overall, the Extreme PRO v2 seems to be a better fit for gaming workloads.
Files Transfer Workloads
The read-write bandwidth recorded for each drive in the cp1, cp2, cp3, cps1, cps2, and cps3 access traces are presented below.
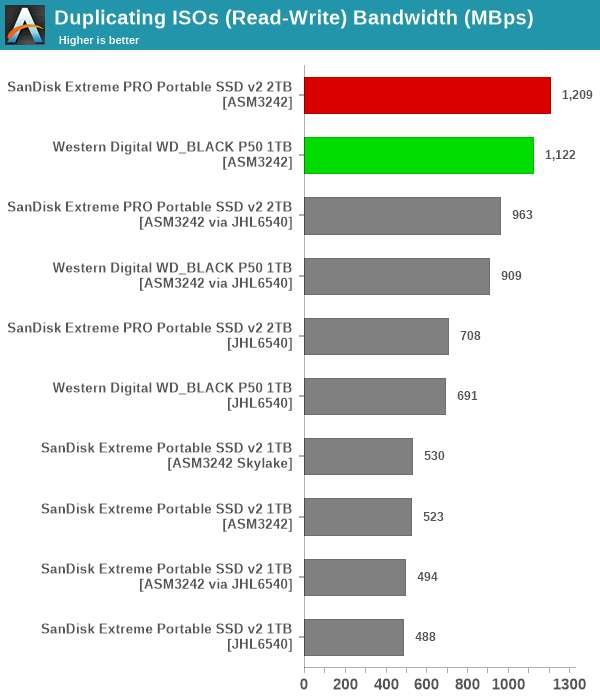
In most workloads, the USB SuperSpeed 20Gbps drives come out on top, with the Extreme PRO v2 slightly edging out the P50.
Overall Scores
PCMark 10 reports an overall score based on the observed bandwidth and access times for the full workload set. The score, bandwidth, and average access latency for each of the drives are presented below.
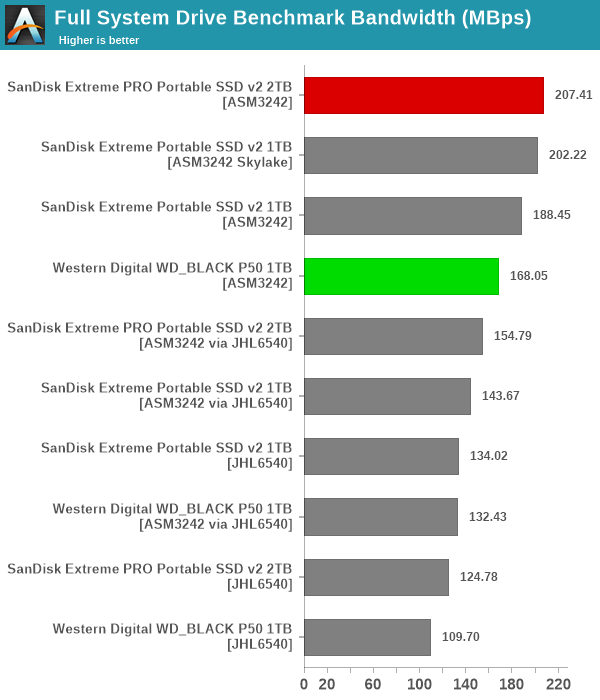
The WD_BLACK P50 scores are a bit behind the Extreme PRO v2 and the Extreme v2 when considered on a testbed-by-testbed basis. When limited by the host port to 10Gbps, the gulf is not significant, though. It may just be that Western Digital has tweaked the firmware of the P50 to cater to gaming workloads alone.


81 Comments
View All Comments
six_tymes - Monday, October 5, 2020 - link
spot on. thank you for posting truths.vol.2 - Monday, October 5, 2020 - link
When I read it, it sounded like the issue was with USB 3.X devices operating on a USB4.0 chipset. My assumption, and I don't think it was explicitly addressed, is that USB4.0 would be "full speed" per it's own specs. Of course, it wasn't explicitly addressed (from what I took away from this), so I phrased my comment as a question; "So wait for USB4 devices then?"repoman27 - Monday, October 5, 2020 - link
You’re reading is pretty much on the money, but the answer to your question is a bit trickier.The first USB4 hosts to hit the market will (probably) be Intel Tiger Lake based products which have integrated Thunderbolt 4 and support USB4 40Gbps. The USB4 spec requires backwards compatibility with USB 3.2, including both the Gen 1 (5Gbps) and Gen 2 (10Gbps) PHYs. It does not, however, require USB3 dual-lane operation (Gen 2x2, 20Gbps), and Intel has not included this optional feature in the controller integrated into Tiger Lake CPUs.
If Intel doesn’t have any plans for integrated USB 3.2 20Gbps, I fail to see how it becomes widespread, unless Apple and AMD both embrace it in their future chipsets. On the other hand, USB 3.2 devices are probably always going to be cheaper than Thunderbolt or USB4 gear. Paying the premium for a USB 3.2 20Gbps device today is somewhat questionable, unless you have a capable host or the performance difference compared to other products when connected to a 10Gbps port is worth it to you.
magreen - Monday, October 5, 2020 - link
Why will USB3.2 20Gbps devices always be cheaper than USB43 gear? It seems likely USB3.2 20 Gbps will be a niche product and without being produced in high volume, street price won't come down. USB4 might be initially expensive, but volume production and competition may bring street prices down to what we see today for USB3.2 Gen 1 5Gbps devices.repoman27 - Monday, October 5, 2020 - link
Because USB4 is essentially Thunderbolt, but even more complicated. It will always take way more silicon and way more power than USB3 on the same node. Thus it’s never going to be as cheap. Economies of scale can’t solve everything.vol.2 - Thursday, October 8, 2020 - link
Sounds about right. I don't have a sudden need for USB 3.2 dual lane. It seems like the best case for more parties to forgo support for it altogether and push USB 4.0. On a related note, USB 3.X has always been very buggy and unstable/unreliable for me, so hopefully 4.X fixes some of that.Meteor2 - Monday, October 26, 2020 - link
Not if you plug a USB4-20Gbps or a USB4-40Gbps SSD into them.YB1064 - Tuesday, October 6, 2020 - link
Why is the ASM2364 winning in every scenario compared to Thunderbolt, if TB offers higher bandwidth? Am I reading this incorrectly?WTF is this godawful nomenclature dumpster fire??? The idiots on the USB standards committee need to be flogged with extreme prejudice.
repoman27 - Tuesday, October 6, 2020 - link
The ASMedia ASM2364 is the PCIe NVMe to USB3 20Gbps bridge chip used by the devices being tested for this review.The ASMedia ASM3242 is the USB3 20Gbps host controller that was used for testing these USB3 20Gbps drives.
The Intel JHL6540 is a Thunderbolt controller which includes an integrated USB3 10Gbps host controller for interoperability with USB3 devices. This was used to test these USB3 drives while connected to a USB3 10Gbps host. The ASM3242 is winning because it supports twice the USB3 signaling rate as the JHL6540.
When connected to a Thunderbolt 3 device, the JHL6540 supports up to 40 Gbit/s. In some of the tests, the ASM3242 card was actually plugged into a Thunderbolt 3 enclosure and connected to the host PC via the JHL6540.
Googer - Tuesday, October 6, 2020 - link
It's kind of sad to think that USB is now faster than SATA. Will there ever be a SATA 4 for SSD and future bulk storage technologies?