The AMD Ryzen 3 3300X and 3100 CPU Review: A Budget Gaming Bonanza
by Dr. Ian Cutress on May 7, 2020 9:00 AM ESTCPU Performance: Rendering Tests
Rendering is often a key target for processor workloads, lending itself to a professional environment. It comes in different formats as well, from 3D rendering through rasterization, such as games, or by ray tracing, and invokes the ability of the software to manage meshes, textures, collisions, aliasing, physics (in animations), and discarding unnecessary work. Most renderers offer CPU code paths, while a few use GPUs and select environments use FPGAs or dedicated ASICs. For big studios however, CPUs are still the hardware of choice.
All of our benchmark results can also be found in our benchmark engine, Bench.
Corona 1.3: Performance Render
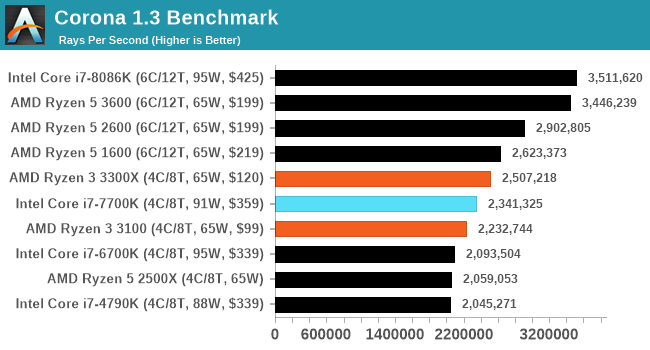
An advanced performance based renderer for software such as 3ds Max and Cinema 4D, the Corona benchmark renders a generated scene as a standard under its 1.3 software version. Normally the GUI implementation of the benchmark shows the scene being built, and allows the user to upload the result as a ‘time to complete’.
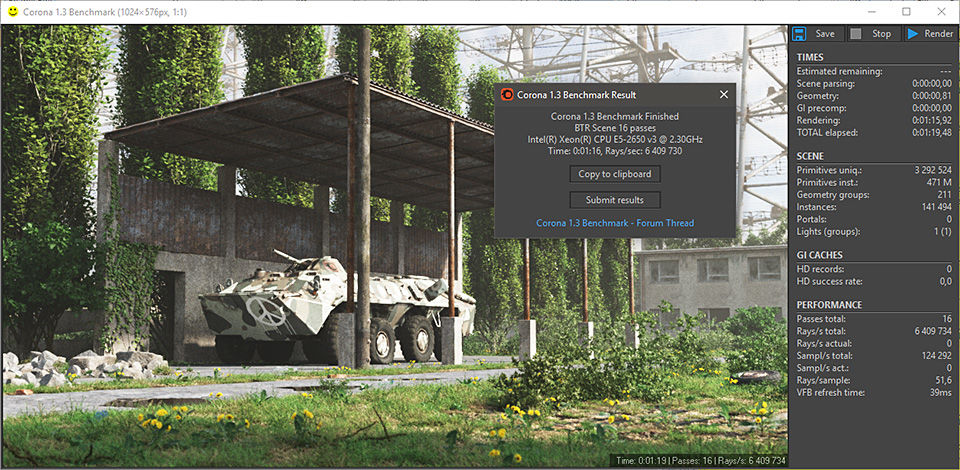
We got in contact with the developer who gave us a command line version of the benchmark that does a direct output of results. Rather than reporting time, we report the average number of rays per second across six runs, as the performance scaling of a result per unit time is typically visually easier to understand.
The Corona benchmark website can be found at https://corona-renderer.com/benchmark
LuxMark v3.1: LuxRender via Different Code Paths
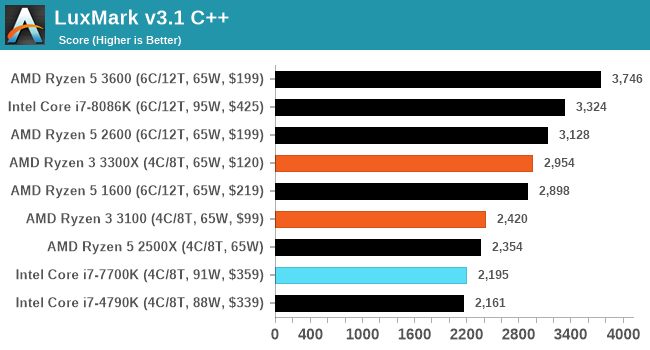
As stated at the top, there are many different ways to process rendering data: CPU, GPU, Accelerator, and others. On top of that, there are many frameworks and APIs in which to program, depending on how the software will be used. LuxMark, a benchmark developed using the LuxRender engine, offers several different scenes and APIs.
In our test, we run the simple ‘Ball’ scene on both the C++ and OpenCL code paths, but in CPU mode. This scene starts with a rough render and slowly improves the quality over two minutes, giving a final result in what is essentially an average ‘kilorays per second’.
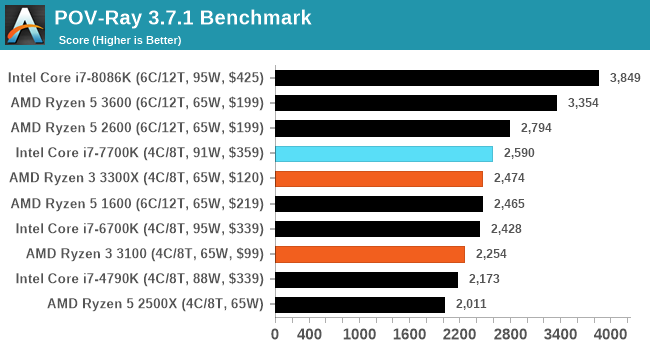
POV-Ray 3.7.1: Ray Tracing
The Persistence of Vision ray tracing engine is another well-known benchmarking tool, which was in a state of relative hibernation until AMD released its Zen processors, to which suddenly both Intel and AMD were submitting code to the main branch of the open source project. For our test, we use the built-in benchmark for all-cores, called from the command line.
POV-Ray can be downloaded from http://www.povray.org/


249 Comments
View All Comments
paulemannsen - Saturday, May 9, 2020 - link
@schujj07 Interesting. Your claim sounds totally alien to me, so can you show us some examples where a CPU is significantly slower in 1080p than in 720p when the GPU isnt the bottleneck pls?schujj07 - Sunday, May 10, 2020 - link
Just look at this review and there are a couple examples of this a 720p and 1080p ultra.Spunjji - Monday, May 11, 2020 - link
@superdawgwtfd - If the resolution is too low then you artificially amplify the differences between CPUs. Meanwhile at 1080p you're testing a resolution people will acttually use for high-frame-rate displays, and a decent GPU is still not going to be the primary limit at that resolution.Fataliity - Friday, May 8, 2020 - link
Also a 7700K should be similar to the new 10th gens with same amount of cores. It's same arch / node. Just frequency changes (and I think the low end new ones are saame or slightly lower.Ian Cutress - Friday, May 8, 2020 - link
7700K was tested last year on the same driver sets. It's been in Bench for a whileschujj07 - Thursday, May 7, 2020 - link
The 9100F is 4c/4t with a 3.6/4.2 clock. The 7700k is 4c/8t with a 4.2/4.5 clock. Since both the 7th & 9th gen are both Sky Lake, they will have identical IPC. Based on that we know that the 9100F will perform worse than the 7700k and makes that inclusion pretty pointless. Not to mention that Ian said he never got review samples of the 9th gen i3's. In a lot of the benchmarks we see the R5 1600 & 2600 and the 1600AF will be right between those 2 CPUs in performance. The inclusion of the 4790k and 8086k are nice as they show comparisons from the top 2014 CPU and 2018 CPU. When it comes to single threaded applications, a stock 8086k will be as fast than as a stock 9900k due to having the same boost and IPC. Therefore we are able to extrapolate a lot of data from this whole thing.Spunjji - Monday, May 11, 2020 - link
You made a succession of excellent points here. Alas, I feel some people would rather use their brain for trolling than for processing the information they claim to want in the course of said trolling.crimson117 - Thursday, May 7, 2020 - link
1600AF performance is identical to the 2600, so just use that.3600 is an unfortunate omission.
schujj07 - Thursday, May 7, 2020 - link
Due to the clock differences between the 2 CPUs that is false. The 1600AF will fall between the 1600 & 2600 in performance.crimson117 - Thursday, May 7, 2020 - link
You're right, not identical, but like 95% the performance at worst and often exactly the same in practice (especially gaming above 1080p): https://www.techspot.com/review/1977-amd-ryzen-160...