The Samsung Galaxy S20+, S20 Ultra Exynos & Snapdragon Review: Megalomania Devices
by Andrei Frumusanu on April 3, 2020 9:30 AM ESTGPU Performance & Power
Moving on, it’s time to talk about the GPUs of the systems. The Snapdragon 865’s Adreno 650 is a microarchitectural successor to last year's Adreno 640, increasing the ALUs and ROPs by 50%. Frequency remains the same at 587MHz, and the company promises a 25% performance boost.
The Exynos 990 is more drastic in its GPU changes. Here we see for the first time a chip using Arm’s new Valhall GPU architecture, in the form of the Mali-G77. We’ve discussed the GPU in detail in the deep dive article last year, so be sure to read about the details of the new design there. Samsung LSI employed an 11-core configuration in the new chip, 1 less core than last year’s G76MP12. This is compensated by clocking the design higher at up to 800MHz, up from 702MHz. The higher clock speed does however cost some additional voltage to reach, with the Exynos 990 now peaking at 712mV compared to the 662mV of the previous iteration, although both designs should be clearly operating at lower than nominal voltages of the process nodes.
Beyond the new GPU hardware, it’s also important to note the new chips are the first of their kind to support LPDDR5, which should bring some good efficiency upgrades to bandwidth hungry tasks such as 3D rendering on a GPU.
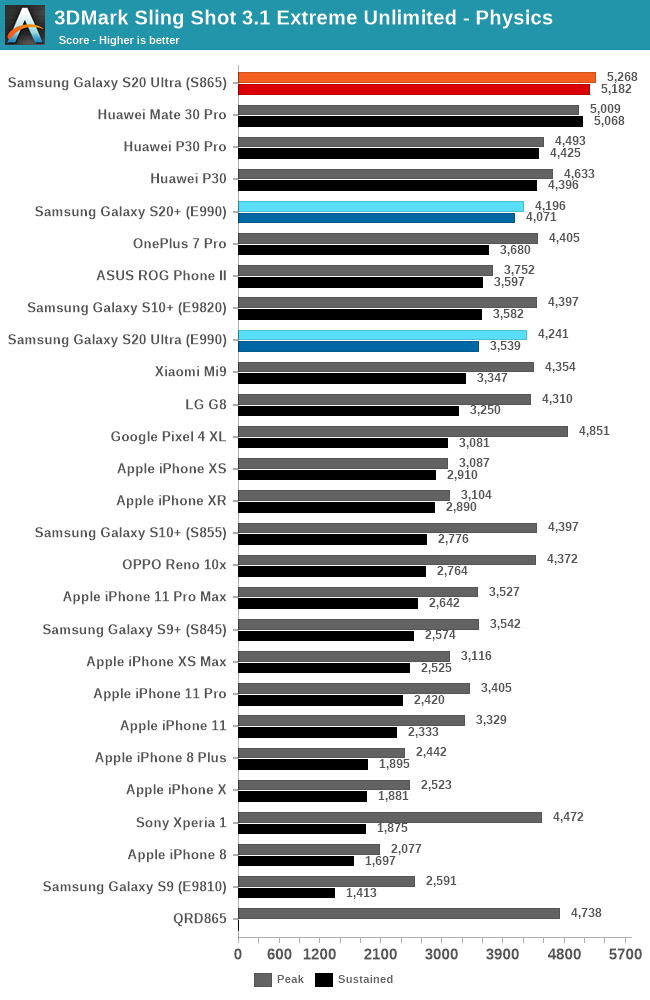
Starting off with 3DMark Physics, which is actually a CPU test in a GPU thermally constrained scenario, we see both phones doing well. The Exynos 990 here likely schedules things more onto the A76 cores, and that’s why performance is less than that of the Snapdragon 865 which here takes the leadership position in the benchmark. Throttling isn’t very prevalent on either device, but for some reason the Exynos Ultra device throttled more than the S20+.
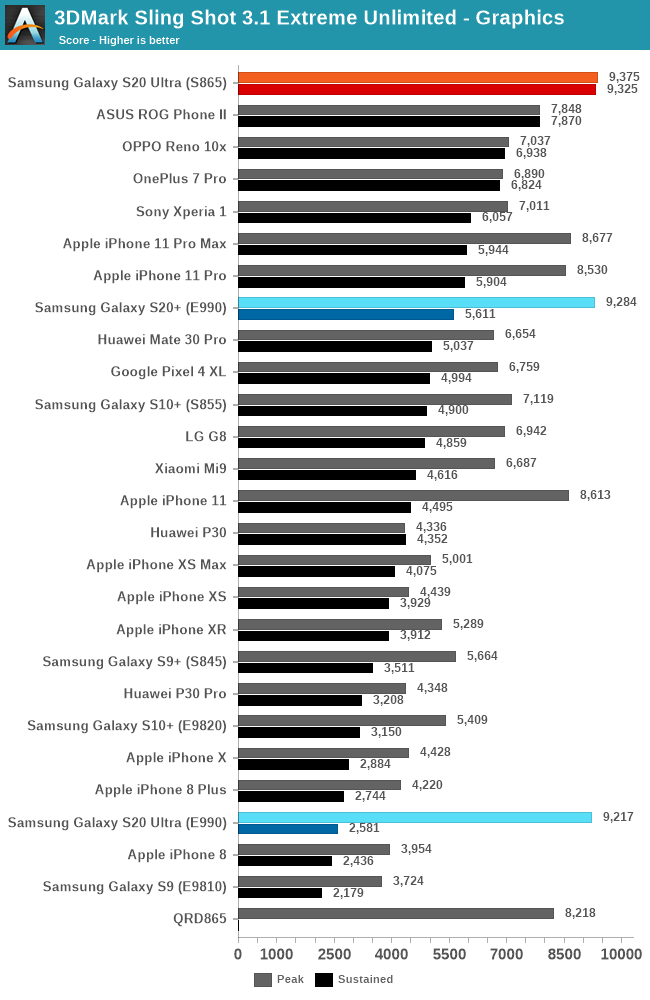
Moving onto the graphics subtest, we’re seeing an extremely stark contrast in scores. The Exynos 990 is able to keep up with the Snapdragon 865’s peak performance figures, however once throttling kicks in, the scores quickly fall down to more moderate figures. The Exynos S20 Ultra’s performance here is again quite puzzling as to why it’s so much worse than the S20+ – both phones didn’t seem to behave very differently in their thermal behavior, so that’s super weird. The performance deficit here is gigantic, with the phone only sustaining 28% of its peak performance.
Meanwhile the Snapdragon S20 Ultra doesn't throttle here at all, and that is absolutely not normal – this is not a chip that is somehow super-efficient or has amazing cooling. Over the years I’ve encountered a lot of such odd results with Snapdragon phones in this benchmark, but this time around I’ve had enough of the weird behavior and I do think there’s some low-level cheating going on. The phone will actually start heating up a lot more than under other workloads, up to the point that the test will actually crash. I don’t understand how that’s possible that this happens only in one benchmark but not others, and the most logical (and likely) explanation is that there’s some benchmark detection going on. Again, I’ve only ever encountered this issue on Snapdragon phones in this test (and we’re also using a custom APK), so it’s super suspicious, but we’re just short of finding the smoking gun that this is some malicious behavior. In any case, please disregard the results as they’re not representative of real behavior.

A few weeks ago, Basemark had finally released their new Basemark GPU version 1.2, which now included some bug fixes in the workloads as well as an iOS variant of the test, finally enabling cross-platform testing for mobile devices. After some internal validations, I’ve deemed it worthy to be added to our GPU suite. I’m using a custom mode at 1440p at medium settings to have it be a little more stressing in terms of the workload.
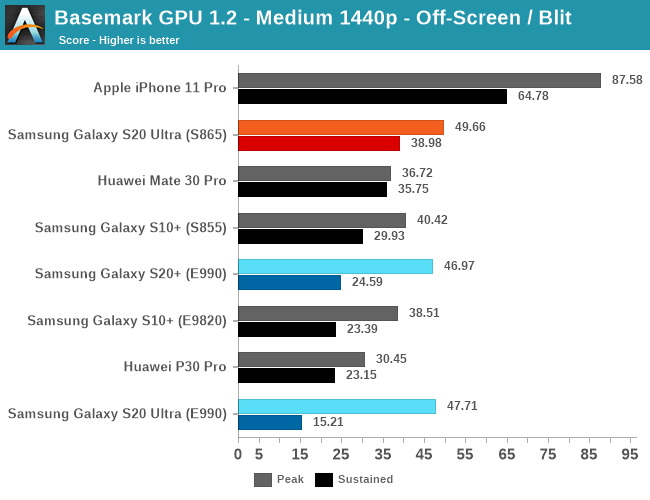
In this new test, we see relatively familiar scaling results, with things being quite on par between the Snapdragon and Exynos SoCs when it comes to their peak performance figures. It’s to be noted just how far ahead Apple’s GPUs are in this test, essentially posting figures almost 2 generations ahead.
Throttling on the Snapdragon 865 S20 Ultra is ok, only losing 22% at thermal equilibrium. The Exynos 990 S20+ was more disappointing, with performance barely better than that of the S10+ last year. The Exynos S20 Ultra again behaved very differently and for some odd reason throttled even more, actually ending up noticeable slower than last year’s model. At only 31% of peak performance, that’s some atrocious performance degradation, probably amongst the worst we’ve ever seen.
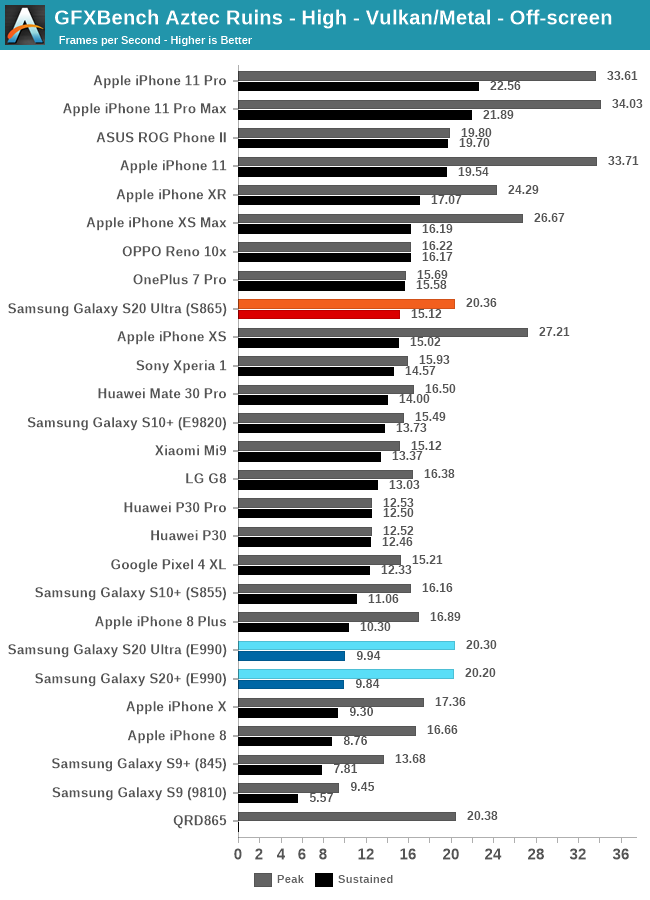
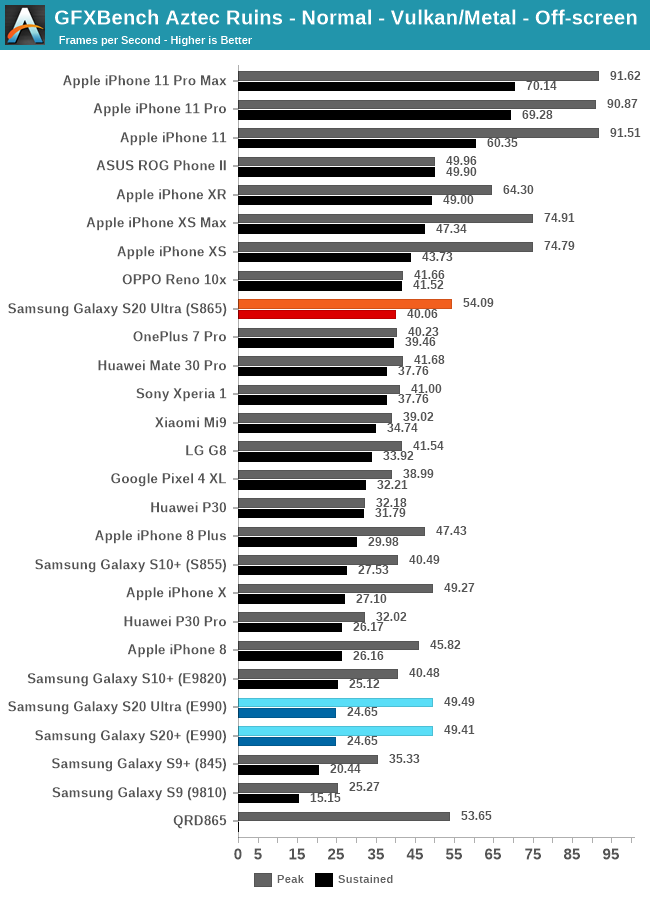
Moving onto GFXBench, we arrive on a familiar playing field. Peak performance of the two chips is identical, however the Exynos chip throttles significantly more. The sustained performance results here are horrible for the Exynos 990 as it’s faring worse than what we had measured on the Exynos 9820 in the S10+.
| GFXBench Aztec High Offscreen Power Efficiency (System Active Power) |
||||
| Mfc. Process | FPS | Avg. Power (W) |
Perf/W Efficiency |
|
| iPhone 11 Pro (A13) Warm | N7P | 26.14 | 3.83 | 6.82 fps/W |
| iPhone 11 Pro (A13) Cold / Peak | N7P | 34.00 | 6.21 | 5.47 fps/W |
| Galaxy S20 Ultra (Snapdragon 865) | N7P | 20.35 | 3.91 | 5.19 fps/W |
| iPhone XS (A12) Warm | N7 | 19.32 | 3.81 | 5.07 fps/W |
| Reno3 (Dimensity 1000L) | N7 | 11.93 | 2.39 | 4.99 fps/W |
| iPhone XS (A12) Cold / Peak | N7 | 26.59 | 5.56 | 4.78 fps/W |
| Mate 30 Pro (Kirin 990 4G) | N7 | 16.50 | 3.96 | 4.16 fps/W |
| Galaxy S20+ (Exynos 990) | 7LPP | 20.20 | 5.02 | 3.59 fps/W |
| Galaxy S10+ (Snapdragon 855) | N7 | 16.17 | 4.69 | 3.44 fps/W |
| Galaxy S10+ (Exynos 9820) | 8LPP | 15.59 | 4.80 | 3.24 fps/W |
Looking at the power measurements of Aztec high, there’s quite the big efficiency differences between the two SoCs. We had already noted that the new Qualcomm Snapdragon 865 had beat our expectations in terms of power efficiency here, sporting very big upgrades compared to the S855. The Exynos 990 on the other hand is quite disappointing in its advancements. It’s a bit better in terms of efficiency, due to it achieving higher performance, but it comes at a higher power cost.
| GFXBench Aztec Normal Offscreen Power Efficiency (System Active Power) |
||||
| Mfc. Process | FPS | Avg. Power (W) |
Perf/W Efficiency |
|
| iPhone 11 Pro (A13) Warm | N7P | 73.27 | 4.07 | 18.00 fps/W |
| iPhone 11 Pro (A13) Cold / Peak | N7P | 91.62 | 6.08 | 15.06 fps/W |
| iPhone XS (A12) Warm | N7 | 55.70 | 3.88 | 14.35 fps/W |
| Galaxy S20 Ultra (Snapdragon 865) | N7P | 54.09 | 3.91 | 13.75 fps/W |
| iPhone XS (A12) Cold / Peak | N7 | 76.00 | 5.59 | 13.59 fps/W |
| Reno3 (Dimensity 1000L) | N7 | 27.84 | 2.12 | 13.13 fps/W |
| Mate 30 Pro (Kirin 990 4G) | N7 | 41.68 | 4.01 | 10.39 fps/W |
| Galaxy S20+ (Exynos 990) | 7LPP | 49.41 | 4.87 | 10.14 fps/W |
| Galaxy S10+ (Snapdragon 855) | N7 | 40.63 | 4.14 | 9.81 fps/W |
| Galaxy S10+ (Exynos 9820) | 8LPP | 40.18 | 4.62 | 8.69 fps/W |
We’re largely seeing the same scaling in Aztec Normal, with the Snapdragon variant leading in power efficiency by 35%.
| GFXBench Manhattan 3.1 Offscreen Power Efficiency (System Active Power) |
||||
| Mfc. Process | FPS | Avg. Power (W) |
Perf/W Efficiency |
|
| iPhone 11 Pro (A13) Warm | N7P | 100.58 | 4.21 | 23.89 fps/W |
| Galaxy S20 Ultra (Snapdragon 865) | N7P | 88.93 | 4.20 | 21.15 fps/W |
| iPhone 11 Pro (A13) Cold / Peak | N7P | 123.54 | 6.04 | 20.45 fps/W |
| iPhone XS (A12) Warm | N7 | 76.51 | 3.79 | 20.18 fps/W |
| Reno3 (Dimensity 1000L) | N7 | 55.48 | 2.98 | 18.61 fps/W |
| iPhone XS (A12) Cold / Peak | N7 | 103.83 | 5.98 | 17.36 fps/W |
| Mate 30 Pro (Kirin 990 4G) | N7 | 75.69 | 5.04 | 15.01 fps/W |
| Galaxy S20+ (Exynos 990) | 7LPP | 85.66 | 5.90 | 14.51 fps/W |
| Galaxy S10+ (Snapdragon 855) | N7 | 70.67 | 4.88 | 14.46 fps/W |
| Galaxy S10+ (Exynos 9820) | 8LPP | 68.87 | 5.10 | 13.48 fps/W |
| Galaxy S9+ (Snapdragon 845) | 10LPP | 61.16 | 5.01 | 11.99 fps/W |
| Mate 20 Pro (Kirin 980) | N7 | 54.54 | 4.57 | 11.93 fps/W |
| Galaxy S9 (Exynos 9810) | 10LPP | 46.04 | 4.08 | 11.28 fps/W |
| Galaxy S8 (Snapdragon 835) | 10LPE | 38.90 | 3.79 | 10.26 fps/W |
| Galaxy S8 (Exynos 8895) | 10LPE | 42.49 | 7.35 | 5.78 fps/W |
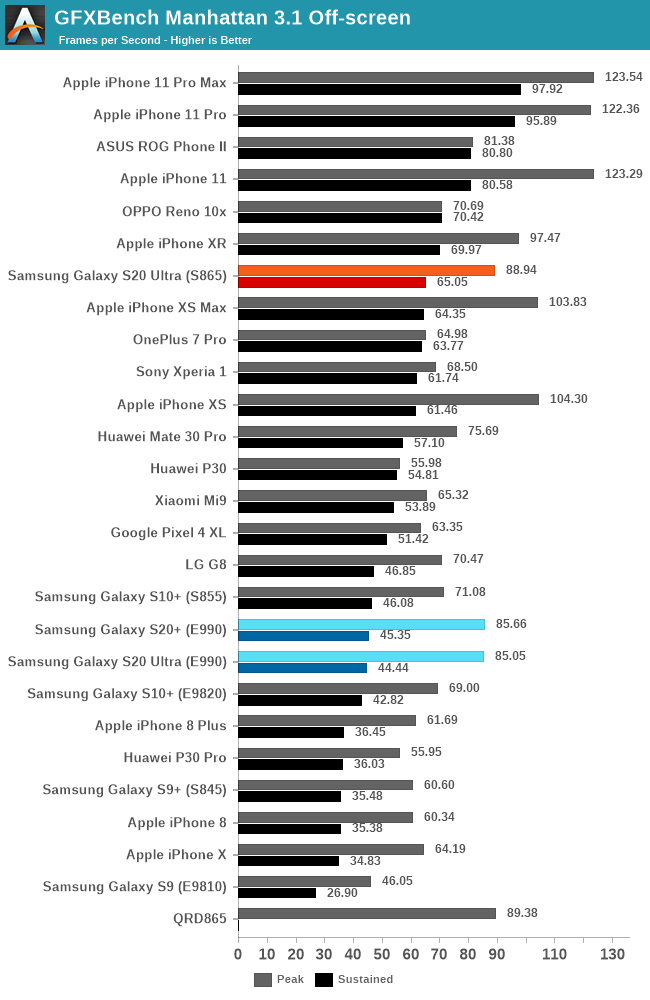
Manhattan 3.1 also isn’t kind to the Exynos S20. The worst figure here is the fact that these S20 variants are barely any faster than the S10 in their sustained performance figures, meaning there’s zero generational improvements.
| GFXBench T-Rex Offscreen Power Efficiency (System Active Power) |
||||
| Mfc. Process | FPS | Avg. Power (W) |
Perf/W Efficiency |
|
| iPhone 11 Pro (A13) Warm | N7P | 289.03 | 4.78 | 60.46 fps/W |
| iPhone 11 Pro (A13) Cold / Peak | N7P | 328.90 | 5.93 | 55.46 fps/W |
| Galaxy S20 Ultra (Snapdragon 865) | N7P | 205.37 | 3.83 | 53.30 fps/W |
| iPhone XS (A12) Warm | N7 | 197.80 | 3.95 | 50.07 fps/W |
| iPhone XS (A12) Cold / Peak | N7 | 271.86 | 6.10 | 44.56 fps/W |
| Galaxy 10+ (Snapdragon 855) | N7 | 167.16 | 4.10 | 40.70 fps/W |
| Reno3 (Dimensity 1000L) | N7 | 139.30 | 3.57 | 39.01 fps/W |
| Galaxy S20+ (Exynos 990) | 7LPP | 199.61 | 5.63 | 35.45 fps/W |
| Mate 30 Pro (Kirin 990 4G) | N7 | 152.27 | 4.34 | 35.08 fps/W |
| Galaxy S9+ (Snapdragon 845) | 10LPP | 150.40 | 4.42 | 34.00 fps/W |
| Galaxy 10+ (Exynos 9820) | 8LPP | 166.00 | 4.96 | 33.40fps/W |
| Galaxy S9 (Exynos 9810) | 10LPP | 141.91 | 4.34 | 32.67 fps/W |
| Galaxy S8 (Snapdragon 835) | 10LPE | 108.20 | 3.45 | 31.31 fps/W |
| Mate 20 Pro (Kirin 980) | N7 | 135.75 | 4.64 | 29.25 fps/W |
| Galaxy S8 (Exynos 8895) | 10LPE | 121.00 | 5.86 | 20.65 fps/W |
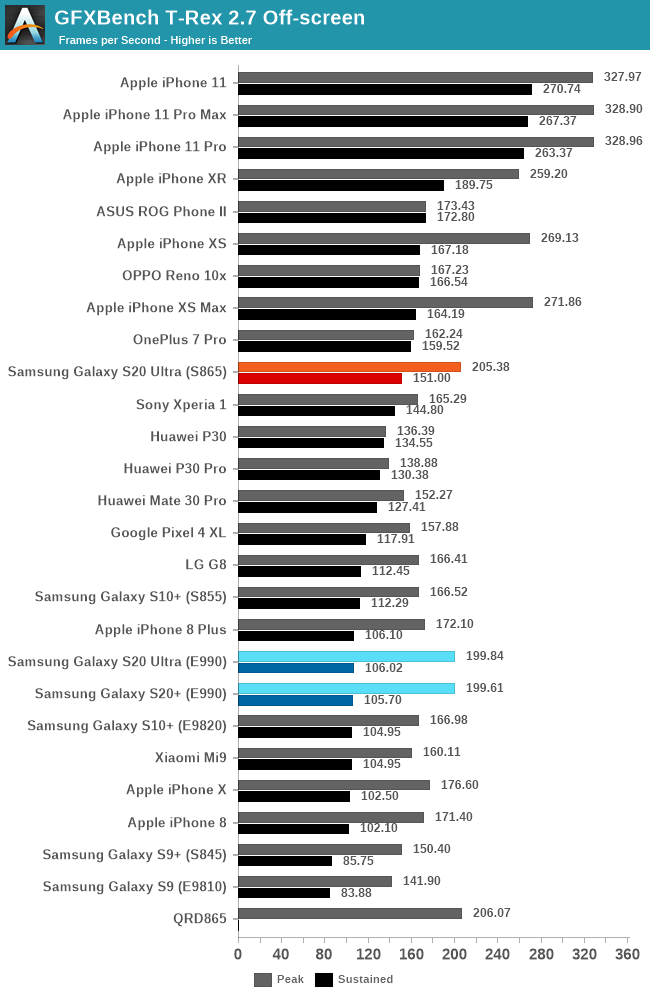
Finally, in T-Rex, things are again quite horrible for the Exynos chip. Sustained performance is a little over half the peak performance figures as the chip suffers from major thermal throttling. Looking at the power draw, we’re reaching an awful 5.63W which is notably worse than the Exynos 9820.
Meager 3D Upgrades – Horrible Exynos Experience
Neither the Snapdragon 865 nor the Exynos 990 variants of the S20 are particularly impressive when it comes to GPU performance.
Starting off with the Snapdragon 865, Qualcomm did excellent in terms of their power efficiency and managing to reduce total power consumption compared to the Snapdragon 855. However the chip is still being curb-stomped by last two generation of Apple SoCs, and there's a lot of catching up to do in this regard.
From a device-standpoint, the Snapdragon S865 S20 barely performed any better than some of the more gaming optimized Snapdragon 855 devices from last year. The silver lining here is that both variants of the phones have outstandingly good thermal characteristics, and are usually not allowed to exceed around 42°C peak skin temperatures.
The Exynos 990 S20 variants are an outright disaster in their gaming performance. The best-case scenario here is that the new phones barely match last year’s Exynos 9820 in sustained performance, with the S20 Ultra behaving extra weirdly and sometimes falling even further behind in performance than that.
For attentive readers who noted the MediaTek Dimensity 1000L in the tables, that’s because I wanted to give some sort of notion of the Mali-G77 in a different SoC. That unfortunately didn’t help too much, as the performance points of the two chips are far too apart to come to any conclusion. What’s clear here is that SLSI clocked the GPU very high to match the peak performance figures of the Snapdragon 865, but it comes at the great cost of higher power consumption at those high frequencies.
The results of the Exynos 990 here reminded me of those of the Kirin 960 and Kirin 970 a few years back. Those parts also came out with some inexplicably horrible power figures, which I've since then heard that the matter was blamed on the use of beta GPU RTL as well as early process PDKs. Ultimately, whether it's due to Samsung's 7LPP process node or the implementation of the Mali-G77 GPU IP, the end result is that the Exynos 990 here just stinks, and those variants of the S20 have to make due with a second-tier experience.


137 Comments
View All Comments
toyeboy89 - Friday, April 3, 2020 - link
I'm really amazed in the fact that the iPhone XR is still beating snapdragon 865 in GFXBench in both peak and sustained performance. I am hoping the OnePlus 8 has better sustained performance.TMCThomas - Friday, April 3, 2020 - link
Amazing review! Always wait for this one before getting a new samsung. And I won't be getting any of the s20 phones. For me the kind of feel like "beta" phones. The 120hz which is not quite ready for 1440p yet, the underutilized 108mp camera, the space zoom which is blurry, the camera hole still being there the big camera bump and so on. I think all these features and more could be way more refined with the next galaxy s which I'll be waiting for. Also the poor exynos 990 performance especially the GPU part is just unacceptable to me. Especially with it probably being a lot better next year, so I'll skip this yearwheeliebin - Friday, April 3, 2020 - link
Thanks Andrei, really good review!I have read many users complain about extra crazy post-processing on the S10/S20 series when there is a face detected in the frame. i.e. the phone will apply an aggressive 'smooth skin' filter that you can't disable unless you shoot RAW. I was hoping that your review might touch on this however there were no people in your example shots so perhaps you didn't get a chance to experience the problem. I wonder if you have heard of this issue and can replicate it yourself with the S20 range?
anonomouse - Friday, April 3, 2020 - link
Hi Andrei, did you also run the bandwidth and MLP sweeps from previous reviews? Last year you noted the Snapdragon 855/A76 had peculiar behavior in the L1, and it would be also interesting to see if there are any MLP changes in both the SD865 and the Exynos.anonomouse - Friday, April 3, 2020 - link
Also, any idea why the new scores for these in 403.gcc seems to be worse than their previous generation products? In particular the score for the SD865 in these S20s is substantially worse than the SD865 score from the QRD preview article.Andrei Frumusanu - Saturday, April 4, 2020 - link
Yes I know. I don't know why that happens. I also got a V60 now and the scores there are higher, I'm wondering if there's something with Samsungs shared libraries.anonomouse - Sunday, April 5, 2020 - link
What type of compile flags are used for these binaries? Are they the same for all of the tested binaries (or even same binary on each given platform)? Are LTO or PGO used (and if not why not)?I'm also not convinced of this statement from the article:
"I had mentioned that the 7LPP process is quite a wildcard in the comparisons here. Luckily, I’ve been able to get my hands on a Snapdragon 765G, another SoC that’s manufactured on Samsung’s EUV process. It’s also quite a nice comparison as we’re able to compare that chip’s performance A76 cores at 2.4GHz to the middle A76 cores of the Exynos 990 which run at 2.5GHz. Performance and power between the two chips here pretty much match each other, and a clearly worse than other TSMC A76-based SoCs, especially the Kirin 990’s. The only conclusion here is that Samsung’s 7LPP node is quite behind TSMC’s N7/N7P/N7+ nodes when it comes to power efficiency – anywhere from 20 to 30%."
Both the energy consumed and the performance scores for both of these A76's seem to also very closely track the "mid" 2.43Ghz A76's on the TSMC-fabbed SD855 - all of which have similar L2's and similar frequencies, but possibly differ significantly (to the point of being suboptimal on latency) on the memory hierarchy and SoC beyond that - which greatly affects many of the SPEC workloads. All of these may also have implementation targets. Given this, is it really conclusive that the Samsung process is truly 20-30% worse in energy efficiency? Granted, things will probably not look pretty next year when TSMC is on a true 5nm and Samsung is not.
Andrei Frumusanu - Monday, April 6, 2020 - link
The test is just -Ofast without any other addition. LTO wasn't/isn't in a good state on the Android NDK - it's something to look into in maybe a new binary revision.As for the 855 figures, well, that's also on an earlier 7nm. HiSilicon did a lot better in terms of they physical implementation. If not against N7, 7LPP clearly has a disadvantage against N7P/N7+.
Andrei Frumusanu - Saturday, April 4, 2020 - link
I'll add them in, that test takes a whole day and I needed the phones doing battery tests and other stuff.dad_at - Saturday, April 4, 2020 - link
Again, your S10+ Exynos results in pc mark are false as of 2020. In performance mode I easily get 9500 work 2.0 overall, about 9600 in browser bench, 21K in photo editing. PC mark in general is inconsistent, irrelevant benchmark, not representative of actual performance in daily usage. The same about these ancient SPEC synthetics. No one uses these for performance evaluation now.