Enterprise NVMe Round-Up 2: SK Hynix, Samsung, DapuStor and DERA
by Billy Tallis on February 14, 2020 11:15 AM ESTMixed Random Performance
Real-world storage workloads usually aren't pure reads or writes but a mix of both. It is completely impractical to test and graph the full range of possible mixed I/O workloads—varying the proportion of reads vs writes, sequential vs random and differing block sizes leads to far too many configurations. Instead, we're going to focus on just a few scenarios that are most commonly referred to by vendors, when they provide a mixed I/O performance specification at all. We tested a range of 4kB random read/write mixes at queue depth 32 (the maximum supported by SATA SSDs) and at QD 128 to better stress the NVMe SSDs. This gives us a good picture of the maximum throughput these drives can sustain for mixed random I/O, but in many cases the queue depth will be far higher than necessary, so we can't draw meaningful conclusions about latency from this test. This test uses 8 threads when testing at QD32, and 16 threads when testing at QD128. This spreads the work over many CPU cores, and for NVMe drives it also spreads the I/O across the drive's several queues.
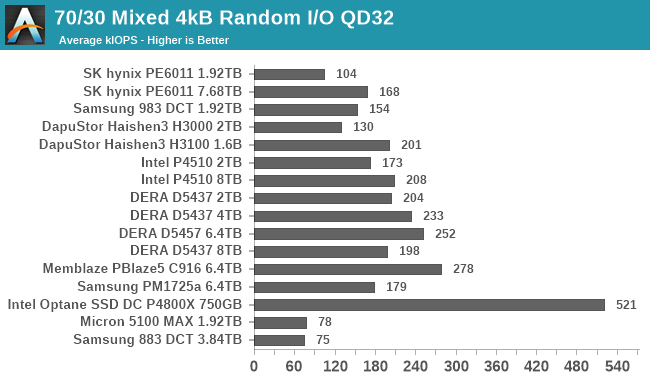
The full range of read/write mixes is graphed below, but we'll primarily focus on the 70% read, 30% write case that is commonly quoted for mixed IO performance specs.
 |
|||||||||
| Queue Depth 32 | Queue Depth 128 | ||||||||
A queue depth of 32 is only enough to saturate the slowest of these NVMe drives on a 70/30 mixed random workload. All of the high-end drives aren't being stressed enough. At QD128 we see a much wider spread of scores. The DERA and Memblaze 6.4TB drives have pulled past the Optane SSD for overall throughput, but the Samsung PM1725a can't come close to keeping up with them—its throughput is more on par with the DERA D5437 drives with relatively low overprovisioning. The high OP ratio on the DapuStor Haishen3 H3100 allows it to perform much better than any of the other drives with 8-channel controllers, and better than the Intel P4510 which has a 12-channel controller.
 |
|||||||||
| QD32 Power Efficiency in MB/s/W | QD32 Average Power in W | ||||||||
| QD128 Power Efficiency in MB/s/W | QD128 Average Power in W | ||||||||
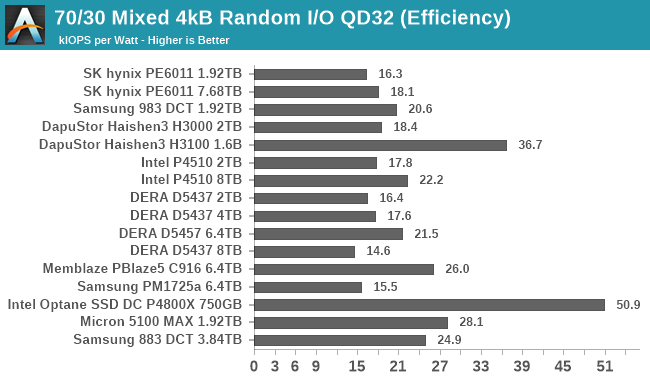
The DapuStor Haishen3 H3100 is the main standout on the power efficiency charts: at QD32 it's the only flash-based NVMe SSD that's more efficient than both of the SATA SSDs, and at QD128 it's getting close to the Optane SSD's efficiency score. Also at QD128 the two fastest 6.4TB drives have pretty good efficiency scores, but still quite a ways behind the Optane SSD: 15-18W vs 10W for similar performance.
 |
|||||||||
| QD32 | QD128 | ||||||||
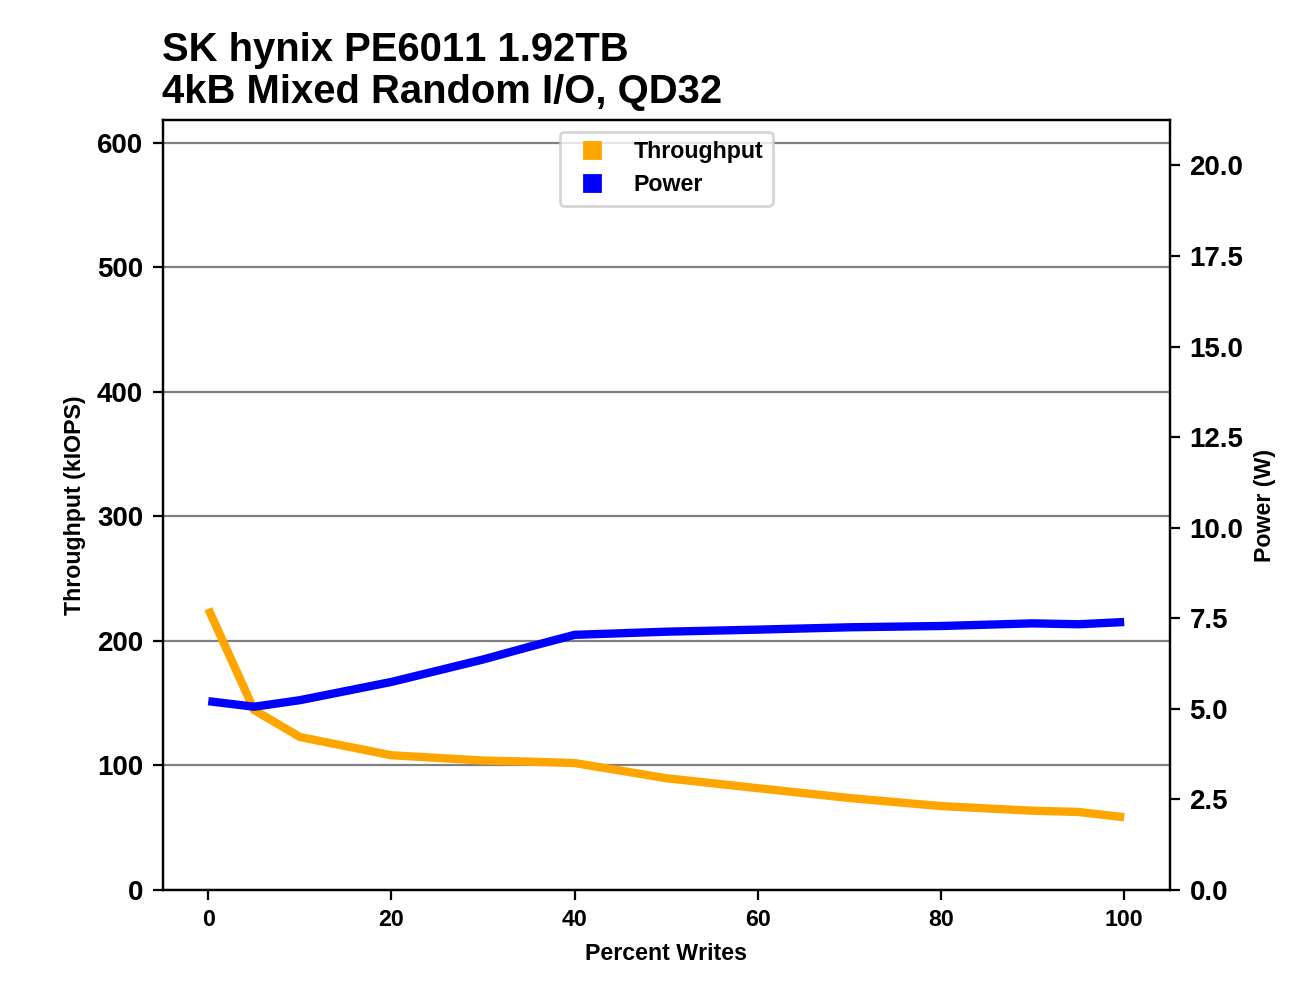
Most of these drives have hit their power limit by the time the mix is up to about 30% writes. After that point, their performance steadily declines as the workload (and thus power budget) shift more toward slower more power hungry write operations. This is especially true at the higher queue depth. At QD32 things look quite different for the DERA D5457 and Memblaze PBlaze5 C916, because QD32 isn't enough to get close to their full read throughput and they're actually able to deliver higher throughput for writes than for reads. That's not quite true of the Samsung PM1725a because its steady-state random write speed is so much slower, but it does see a bit of an increase in throughput toward the end of the QD32 test run as it gets close to pure writes.
Aerospike Certification Tool
Aerospike is a high-performance NoSQL database designed for use with solid state storage. The developers of Aerospike provide the Aerospike Certification Tool (ACT), a benchmark that emulates the typical storage workload generated by the Aerospike database. This workload consists of a mix of large-block 128kB reads and writes, and small 1.5kB reads. When the ACT was initially released back in the early days of SATA SSDs, the baseline workload was defined to consist of 2000 reads per second and 1000 writes per second. A drive is considered to pass the test if it meets the following latency criteria:
- fewer than 5% of transactions exceed 1ms
- fewer than 1% of transactions exceed 8ms
- fewer than 0.1% of transactions exceed 64ms
Drives can be scored based on the highest throughput they can sustain while satisfying the latency QoS requirements. Scores are normalized relative to the baseline 1x workload, so a score of 50 indicates 100,000 reads per second and 50,000 writes per second. Since this test uses fixed IO rates, the queue depths experienced by each drive will depend on their latency, and can fluctuate during the test run if the drive slows down temporarily for a garbage collection cycle. The test will give up early if it detects the queue depths growing excessively, or if the large block IO threads can't keep up with the random reads.
We used the default settings for queue and thread counts and did not manually constrain the benchmark to a single NUMA node, so this test produced a total of 64 threads scheduled across all 72 virtual (36 physical) cores.
The usual runtime for ACT is 24 hours, which makes determining a drive's throughput limit a long process. For fast NVMe SSDs, this is far longer than necessary for drives to reach steady-state. In order to find the maximum rate at which a drive can pass the test, we start at an unsustainably high rate (at least 150x) and incrementally reduce the rate until the test can run for a full hour, and the decrease the rate further if necessary to get the drive under the latency limits.
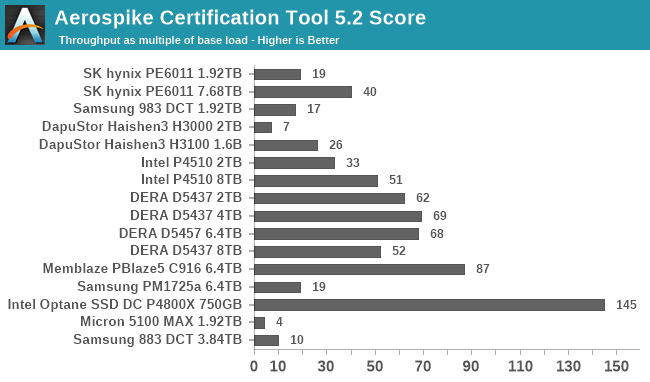
The strict QoS requirements of this test keep a number of these drives from scoring as well as we would expect based on their throughput on our other tests. The biggest disappointment is the Samsung PM1725a that's barely any faster than their newer 983 DCT. The PM1725a has no problem with outliers above the 8ms or 64ms thresholds, but it cannot get 95% of the reads to complete in under 1ms until the workload slows way down. This suggests that it is not as good as newer SSDs at suspending writes in favor of handling a read request. The DapuStor Haishen3 SSDs also underperform relative to comparable drives, which is a surprise given that they offered pretty good QoS on some of the pure read or write tests.
The Memblaze PBlaze5 C916 is the fastest flash SSD in this bunch, but only scores 60% of what the Optane SSD gets. The DERA SSDs that also use 16-channel controllers are the next fastest, though the 8TB D5437 is substantially slower than the 4TB model.
 |
|||||||||
| Power Efficiency | Average Power in W | ||||||||
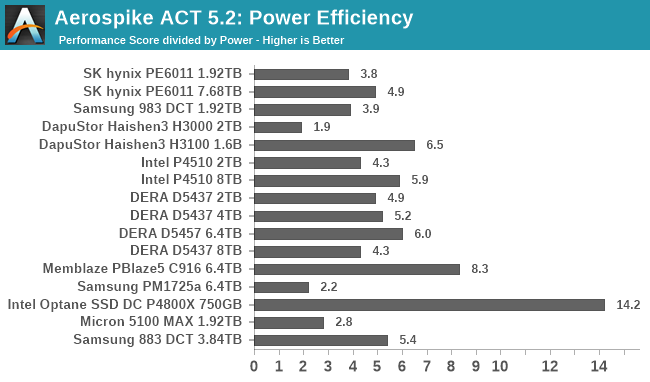
Since the ACT test runs drives at the throughput where they offer good QoS rather than at their maximum throughput, the power draw from these drives isn't particularly high: the NVMe SSDs range from roughly 4-13 W. The top performers are also generally the most efficient drives on this test. Even though it is slower than expected, the DapuStor Haishen3 H3100 is the second most efficient flash SSD in this round-up, using just over half the power that the slightly faster Intel P4510 requires.


33 Comments
View All Comments
James5mith - Monday, February 17, 2020 - link
"... but I would gladly purchase a high performance 16TB SSD."Then do so. They aren't ridiculously priced anymore. It's $2000-$4000 per drive depending on manufacturer and interface type.
What is stopping you?
The Micro 9300 Pro 15.36TB is ~$3000 on average. That's a U.2. interface drive. Too slow?
eek2121 - Monday, February 17, 2020 - link
The lack of an M.2 offering? I have yet to find a single 16 TB M.2 SSD available for retail purchase. I have no problem plunking down a few thousand (provided the performance is comparable to Samsung's offerings).CrystalCowboy - Tuesday, February 18, 2020 - link
Most enterprise drives come either in U.2 or in PCIe. And you can buy PCIe-U.2 adapters.CrystalCowboy - Tuesday, February 18, 2020 - link
For that matter, M.2 - U.2 adapters are available and cheap.NV_Me - Friday, February 14, 2020 - link
Thanks for all of the insights Billy! BTW I like the addition of the drop down selection on top,For the PE6011, what is the TBW on either the 1.92TB or 7.68TB drive? I was curious to know if this was a true "1 DWPD" drive.
Billy Tallis - Friday, February 14, 2020 - link
The full spec sheet for the PE6011 just says 1.0 DWPD. It doesn't list TBW.NV_Me - Friday, February 14, 2020 - link
Next time would it be possible to RANK the charts high-low or low-high for improved readability?Hul8 - Saturday, February 15, 2020 - link
If you retain the order, it's easier to compare performance of particular drives by glancing from one chart to the next. That's important with a 9-drive roundup.Normally when they're doing a single product review, that product is highlighted in one color, and it's predecessors or alteratives with another. In that case those items can always be easily spotted in a ranked graph.
JohnLee-SZ - Friday, February 14, 2020 - link
Thanks very much Billy, it's a great review! We DapuStor are continuing developing the whole product portfolio and hope we can deliver some great products to fulfill industry needs.CrystalCowboy - Tuesday, February 18, 2020 - link
PCIe 3.0? Are we supposed to take this seriously?