The AMD Radeon RX 5600 XT Review, Feat. Sapphire Pulse: A New Challenger For Mainstream Gaming
by Ryan Smith on January 21, 2020 9:01 AM ESTSynthetics
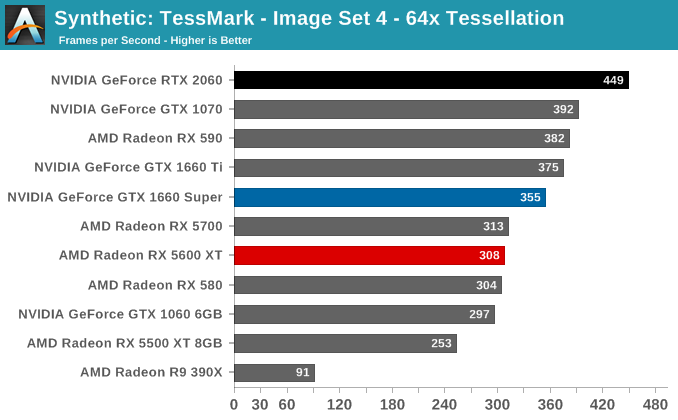
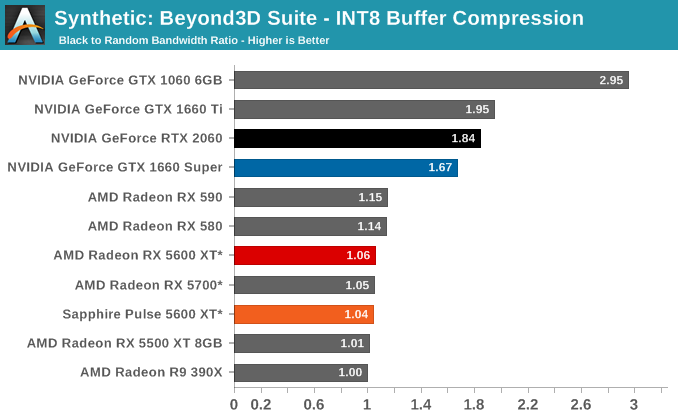
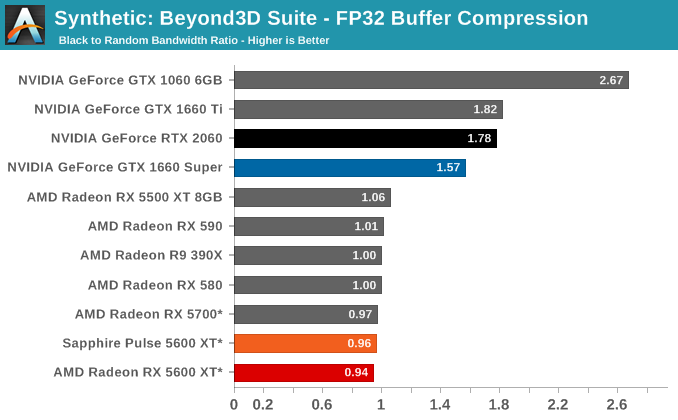
Moving on, we have our synthetic performance testing, taking a look at geometry throughput, pixel throughput, memory compression, and more.
Given the significance of cutting a quarter of Navi 10’s GDDR6 memory bus, I was very curious to see what that would do for synthetic performance. But for better or worse, this has created more questions than it has solved.
The numbers listed below are accurate, in as much as these are the results I get when testing these cards. Whether they are correct, however, is another matter.
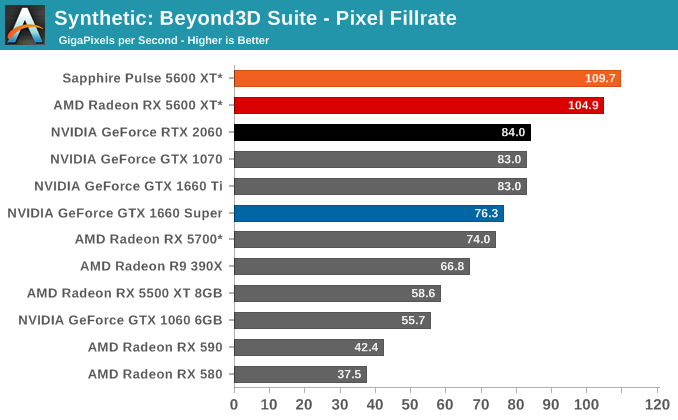
The problem, in short, is that due to AMD’s very aggressive power savings/idling implementation for their Navi 10 cards, I have been unable to get these cards to run at their full memory clockspeeds when executing the the Beyond3D Suite benchmark suite. The GPU clocks regularly pass 1600MHz like they should, however AMD’s telemetry is reporting that memory clocks are rarely hitting 7Gbps, let alone 12Gbps+. As a result, we end up with results like the pixel test below, where the RX 5600 XT is beating the RX 5700, an otherwise impossible outcome.
As best as I can tell, this issue has been going on since the launch of the Radeon RX 5700 series back in July, but it’s only now that I’ve noticed it, in large part due to the RX 5600 XT cards being slightly less aggressive in their idling. In other words, those cards are boosting to higher memory clockspeeds more often, putting them ahead of the RX 5700 and bringing the clocking issue front and center.
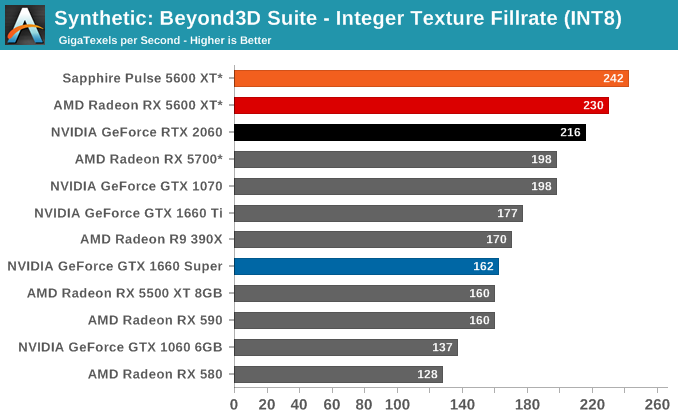
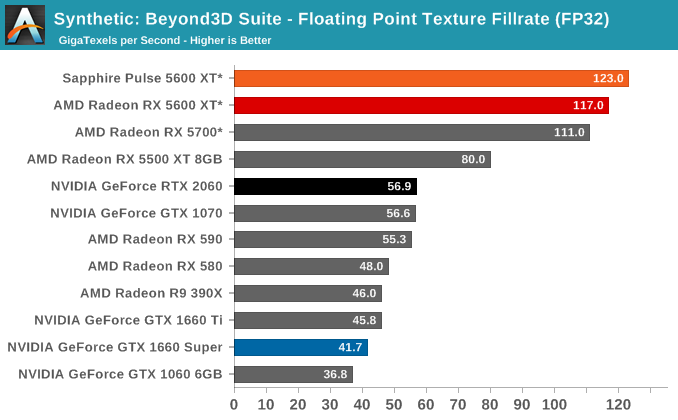
I’m still working on a proper fix for the issue, but for now the results with Navi 10 cards should be taken with a large grain of salt. The benchmark itself is still fine, but AMD’s aggressive power management (and lack of an easy means to disable it) is kneecapping AMD’s performance in these benchmarks.


202 Comments
View All Comments
Korguz - Tuesday, January 21, 2020 - link
how does that make them skewed ??Spunjji - Wednesday, January 22, 2020 - link
A significant outlier will have an outsized influence on the average; GTA V being out-of-line from typical results makes the Nvidia card look a little better than it actually is (unless you're a GTA V player).In the case of this specific review, their "relative performance" metrics are affected by that. Personally, I don't think it's significant enough to worry about.
Martin84a - Tuesday, January 21, 2020 - link
Still uses 4x the power in dual-monitor configuration compared to my current 1070 ti :/ This has been an issue for AMD cards for quite a long time.https://tpucdn.com/review/sapphire-radeon-rx-5600-...
ryrynz - Tuesday, January 21, 2020 - link
Quiter not QuitterTheReason8286 - Tuesday, January 21, 2020 - link
Lol Quieter*Lord of the Bored - Thursday, January 23, 2020 - link
Quieter not Quitter, not Quiter not Quitter.dairyAT - Tuesday, January 21, 2020 - link
Test Setup page lists a NVIDIA GeForce RTX 2060 Super, but the review charts are labeled NVIDIA GeForce RTX 2060. Which is it?Ryan Smith - Tuesday, January 21, 2020 - link
It's the regular RTX 2060.just4U - Tuesday, January 21, 2020 - link
Wow.. didn't think it would be that good. Nice review Ryan.Hrel - Tuesday, January 21, 2020 - link
This doesn't mention the ko edition.... Charts don't include the 2060 super either...Wth?