The Microsoft Surface Laptop 3 Showdown: AMD's Ryzen Picasso vs. Intel's Ice Lake
by Brett Howse & Andrei Frumusanu on December 13, 2019 8:30 AM ESTBenchmark Analysis: Boost Behavior
Let’s dig into some of the testing to see how the systems responded during the benchmarks. We re-ran several of the tests while simultaneously monitoring the processor frequency, temperature, and power. Unfortunately for our comparison, the power polling results provided by our monitoring tools don’t seem to monitor the same power draw. The Intel power numbers are for the SoC package, but the AMD power numbers appear to be just the CPU cores, which is an unfortunate byproduct of testing two different platforms.
PCMark 10

PCMark 10 is a benchmark platform that attempts to simulate real-world tasks by running a variety of workflow, and the results were perhaps the most interesting of any of the benchmarks. There is a major discrepancy in how the AMD CPU behaved compared to the Intel. The Ice Lake platform kept the CPU frequency at a minimum of 3.5 GHz, with bursts to 3.9 GHz when under load. The Picasso processor was very aggressively switching from low frequency to high frequency, and was rarely indicating that it was over 3.0 GHz, but clearly demonstrating its higher peak frequency of 4.0 GHz in several locations. Both systems were fairly even in terms of CPU temperature, and Intel’s aggressive turbo levels were evident with peak power levels of 40 Watts for brief moments. The Ice Lake platform finished the benchmark about 200 seconds quicker than the Picasso system.
Cinebench R20 Single-Thread
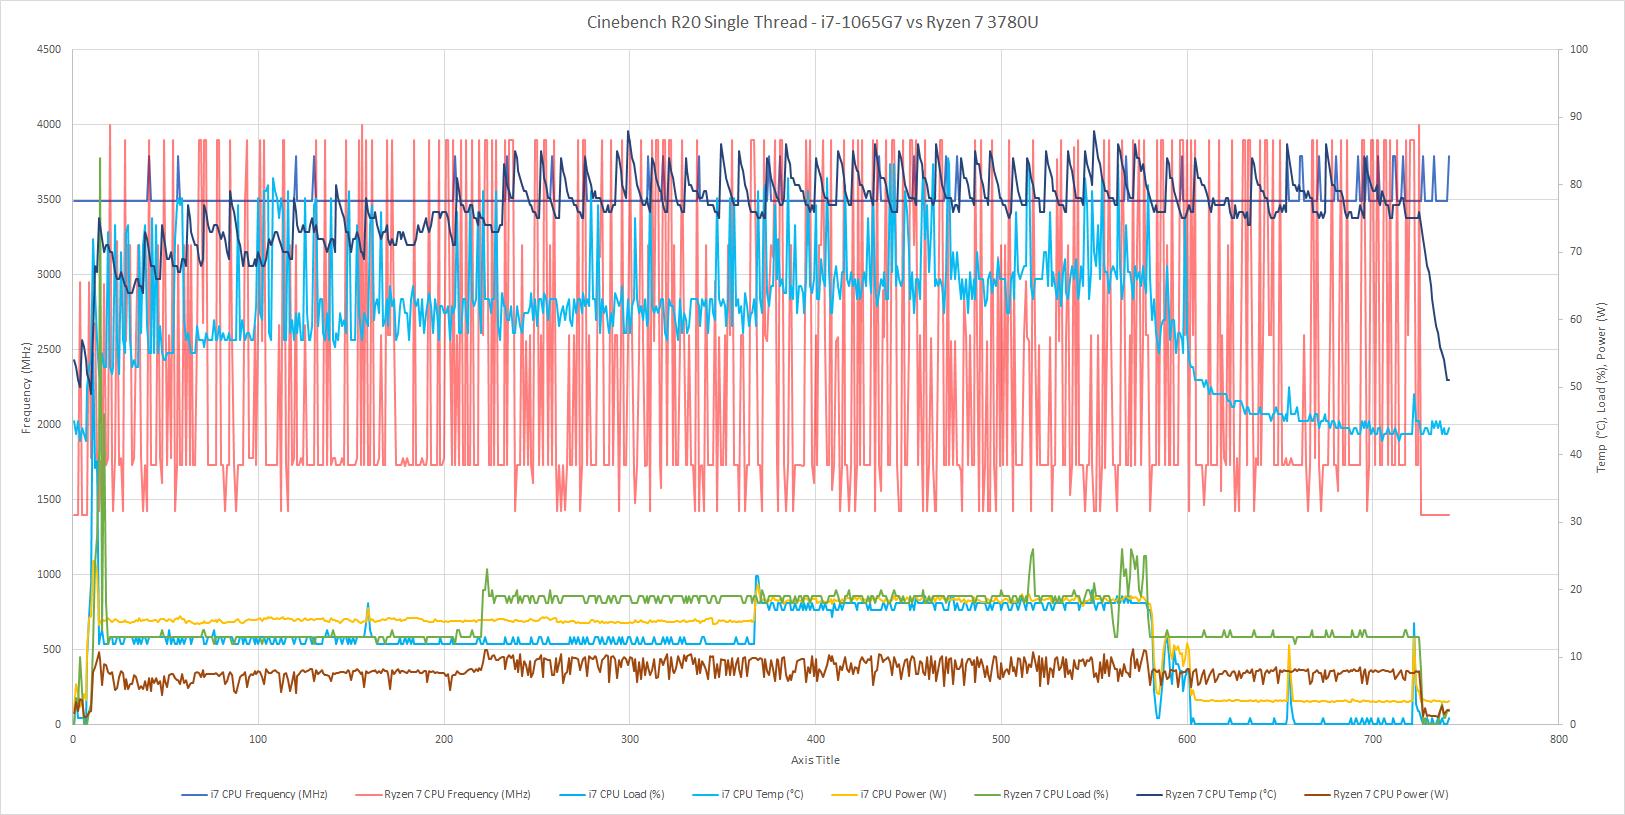
We see somewhat similar results when only a single CPU core is loaded with the Picasso CPU frequency varying quite a bit. There’s also an average higher temperature on the AMD platform during this workload, and once again Ice Lake finishes the rendering quite a bit sooner thanks to its stronger CPU cores.
Cinebench R20 Multi-Thread
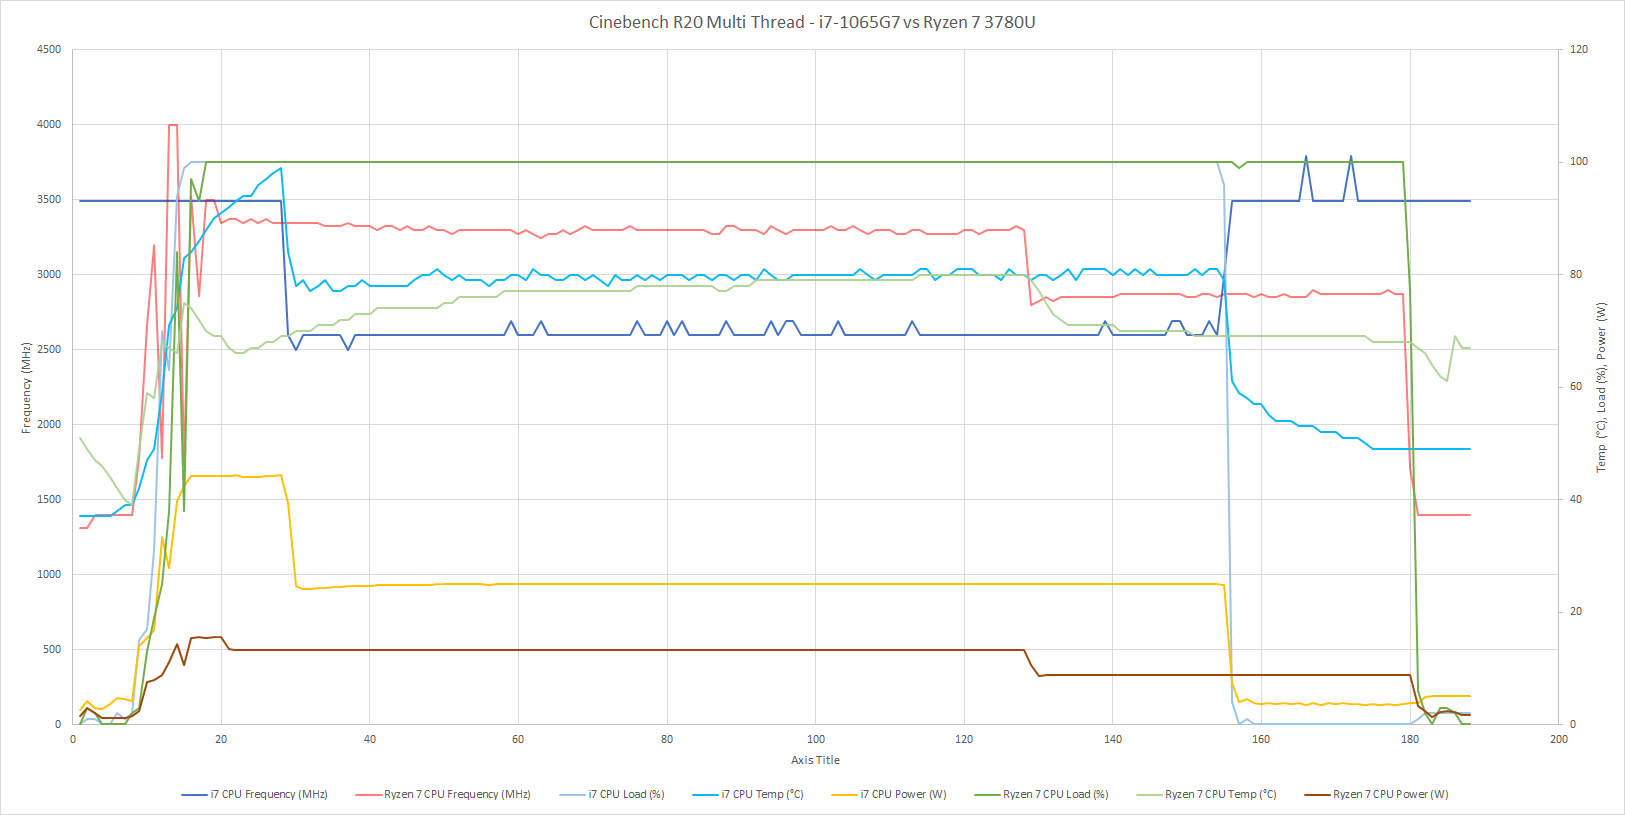
With all cores loaded the graph is considerably altered. Here the AMD processor is able to maintain a much higher frequency across its cores for much longer, while Intel's chip is only able to maintain 3.5 GHz for about 30 seconds before it runs out of headroom, dropping the cores down to around 2.6 GHz. But despite the lower frequency, the much higher IPC on Sunny Cove allows the Ice Lake platform to finish quite a bit sooner.


174 Comments
View All Comments
Fataliity - Friday, December 13, 2019 - link
And I dont see a single page about temps? Is that because it runs at 90-100 C?extide - Friday, December 13, 2019 - link
There is an entire page of graphs with temps...dullard - Friday, December 13, 2019 - link
Exactly, but looking at Fatality's post above, it did not appear like Fatality wanted to see the actual truth. The CPU temps were not much different.https://images.anandtech.com/doci/15213/PCMark10.p...
Fataliity - Friday, December 13, 2019 - link
Every other website shows temps here.https://openbenchmarking.org/embed.php?i=1911040-H...
Over 90 celsius.
That single graph isnt a good comparison for temps. That's why its littered with 'frequency' and 'power'. to distort it.
Fataliity - Friday, December 13, 2019 - link
So it's not about "Not wanting to see the truth" It appears either anandtech's truth for temps is based on light workloads where the cpu isn't stressed at all, or possibly just wrong.Fataliity - Friday, December 13, 2019 - link
And this is supposed to be a "Showdown" between Ryzen and Intel. Not a "spotlight" or "sponsored" intel piece. So the way things were presented is very biased.I fully expect Intel's CPU to beat Ryzen, thats for sure. And graphics on higher than value setting, Ryzen scores about 5-10 fps higher. But on this review, It's intentionally skewed for Intel.
You should've just made a separate article for each if you were planning on favoring one company. And show their positives and negatives. Not focus on every possible positive of Intel and hide everything negative.
It's just not right, where people expect you to give a non-biased review to base their purchase off of.
Fataliity - Friday, December 13, 2019 - link
https://www.phoronix.com/scan.php?page=news_item&a...Link to article where graph is from.
Fataliity - Friday, December 13, 2019 - link
And how it actually performs in gaming, when your not using the IPC of Ice Lake to increase performance. The guy has plenty other videos if you care to watch.https://www.youtube.com/watch?v=B9FgYx2z0NY&t=...
maroon1 - Saturday, December 14, 2019 - link
PointlessThis is apu vs apu. It should be compared the way it is made
dullard - Friday, December 13, 2019 - link
1) Anandtech posted multiple graphs, I just linked one. Please actually read the article and look at all the data before posting here.2) Having additional data on a graph does not distort the temperatures that were measured.
3) You can't compare one laptop's temperature to another completely different laptop's temperature and have any conclusions that are valid (your link to a Dell XPS is not compariable to this article on a Microsoft Surface). This is because each laptop has completely different cooling systems, fan speeds, etc.
4) The temps were done doing things like multi-threadded Cinebench. If that is too light of a load for you, feel free to do your own test and post them here. https://images.anandtech.com/doci/15213/CinbenchR2...