The Apple iPhone 11, 11 Pro & 11 Pro Max Review: Performance, Battery, & Camera Elevated
by Andrei Frumusanu on October 16, 2019 8:30 AM ESTGPU Performance & Power
We covered the CPUs of the A13 in detail, but there’s also the GPU we have to consider. Apple’s performance improvement claims for this year have been a little more conservative, with the company promising a 20% performance increase or a 40% decrease in power at the same performance as the A12. Last year’s jump was a rather large one, and we don’t expect Apple (or any vendor for that matter) to repeat it any time soon, especially as we saw both major microarchitectural changes as well as the adoption of the new 7nm manufacturing node at the same time.
Beyond the raw performance of the chipset and the GPU, what’s important for gaming is the actual device’s thermal characteristics and how it’s able to dissipate and sustain the high heat generation of the SoC. For the A12 I did criticize Apple in terms of being extremely aggressive on the peak power that the phones were allowed to start off with in 3D workloads. This resulted in the phones not really able to sustain these performance levels more than 2-3 minutes before having to throttle down.
This year beyond the promised efficiency gains, Apple has said they’ve improved the device’s SoC cooling capabilities, being able to better spread the heat from the SoC to the body of the phone and as such allow the silicon to retain higher performance states.
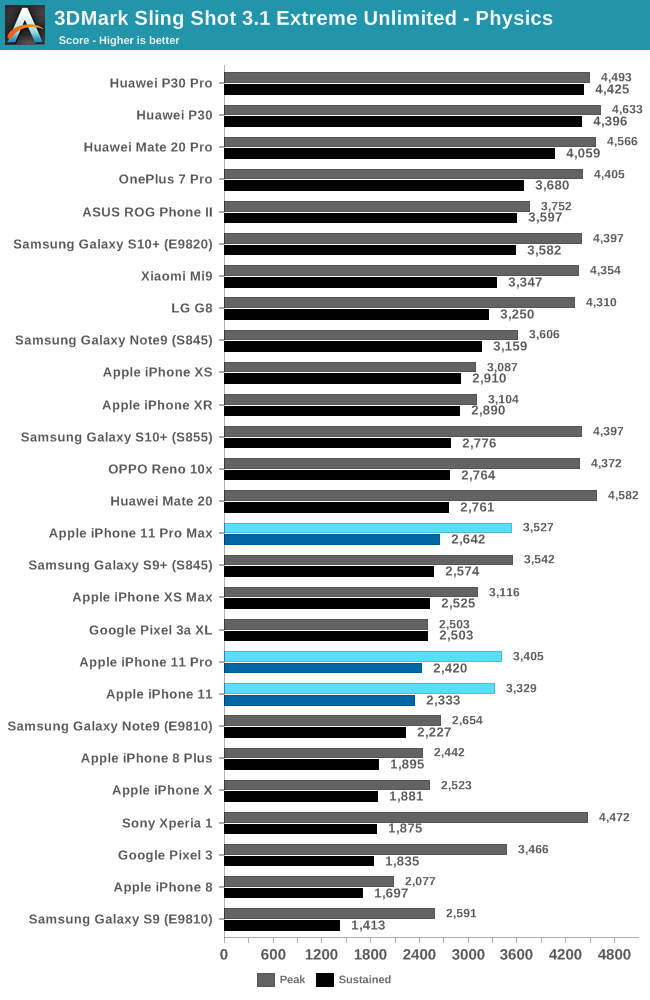
Starting off with the physics test in 3DMark, this is actually more of a CPU workload when power constrained during a GPU workload. In this scenario, the iPhone 11’s fare a bit better in terms of peak performance compared to last year’s iPhones, however they weren’t quite able to maintain the same sustained performance as we saw on the A12 iPhones.
The iPhone 11 Pro Max showcased the better scores than its siblings, and that’s not too much of a surprise given that the phone has the biggest form-factor and thermal envelope to be able to dissipate larger amounts of heat.
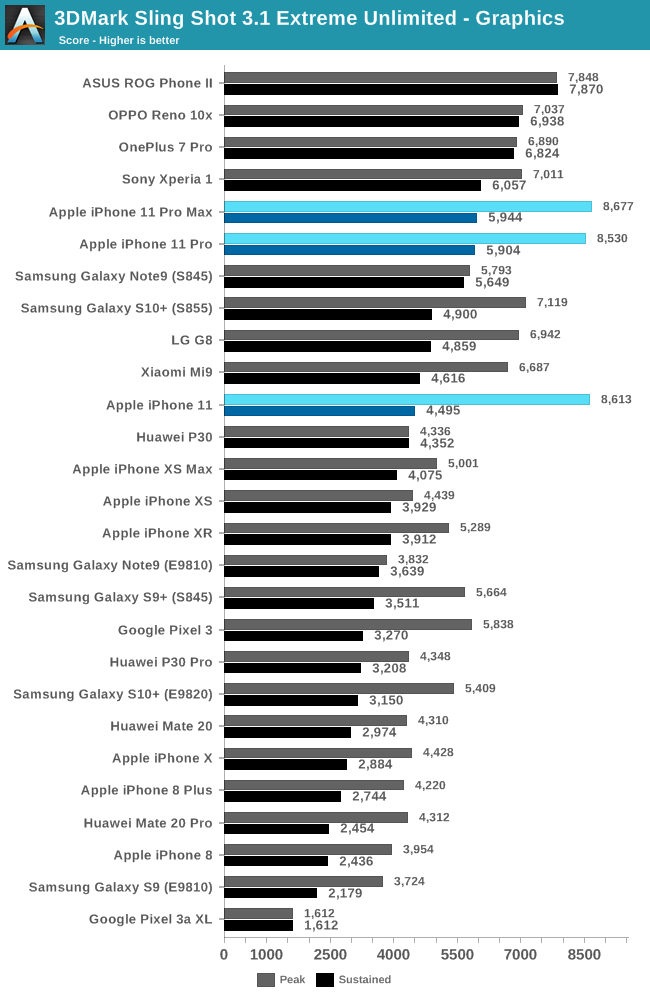
Switching over to the graphics workload which puts a maximum amount of stress on the GPU, we here now see major changes in the scores and rankings. First of all, the new iPhone 11s and the A13 now showcase significant performance increases compared to the A12 devices last year. I’ve noted that Apple was oddly weak in 3DMark when we analyzed the chip, and it looks like Apple was able to resolve whatever the bottleneck was this generation, showcasing a 38% increase in performance. I’ve actually gone back and quickly retested the iPhone XS on iOS13 and did see a 20% increase in performance compared to what we see in the graphs here; I’ll be updating those device’s scores as soon as I have more time.
The iPhone 11 Pros are doing much better than the regular iPhone 11 when it comes to the sustained performance results. I’m actually a bit surprised here given that these are the phones which have the SoC sandwiched between two stacked PCBs, but it seems Apple is able to cool off that whole assembly decently enough. The iPhone 11's scores here are a bit disappointing as it represents an almost 50% degradation in performance.
The new iPhones don’t score quite as well as some Snapdragon 855(+) devices, but this is rather because Apple does not allow the iPhones to get nearly as hot as some of these other devices. I wasn’t able to measure skin temperatures above 41°C on any of the new iPhones.
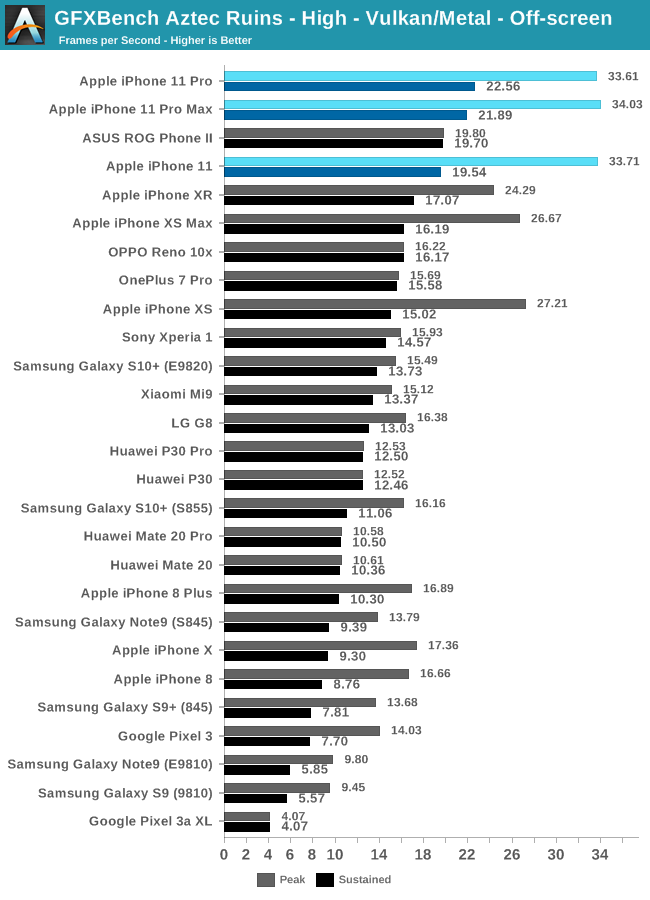
In the GFXBench Aztec High test, Apple’s microarchitecture is better able to flex its muscles and more clearly takes the lead in terms of both peak and sustained performance. Comparing the iPhone 11 Pro to the iPhone XS, we see a 23% increase in peak performance, and most importantly a much more impressive 50% increase in sustained performance.
| GFXBench Aztec High Offscreen Power Efficiency (System Active Power) |
||||
| Mfc. Process | FPS | Avg. Power (W) |
Perf/W Efficiency |
|
| iPhone 11 Pro (A13) Warm | 7FFP | 26.14 | 3.83 | 6.82 fps/W |
| iPhone 11 Pro (A13) Cold / Peak | 7FFP | 34.00 | 6.21 | 5.47 fps/W |
| iPhone XS (A12) Warm | 7FF | 19.32 | 3.81 | 5.07 fps/W |
| iPhone XS (A12) Cold / Peak | 7FF | 26.59 | 5.56 | 4.78 fps/W |
| Galaxy 10+ (Snapdragon 855) | 7FF | 16.17 | 4.69 | 3.44 fps/W |
| Galaxy 10+ (Exynos 9820) | 8LPP | 15.59 | 4.80 | 3.24 fps/W |
Measuring the power consumption, we again see that the A13 devices are extremely aggressive in their peak power, exceeding 6.2W. What is interesting here is even at this peak power-hungry performance state, the A13 is more efficient than the A12, and massively more efficient than the competition.
As usual, running a workload for a few minutes until the phone gets lukewarm (not to be mistaken with the longer sustained performance states in the benchmark graphs) will lower the performance and power to more reasonable levels. We’re able to make almost apples-to-apples comparisons here between the A13 and A12 iPhones: at roughly the same 3.8W power usage, the new A13 based device is able to showcase a 35% increase in performance. This performance state of the A13 actually corresponds to the peak performance of the A12, so that’s really nice as we’re able to do the same comparison but for the performance axis: At the same performance of the A12, the A13 is able to use 32% lower power. Not quite the 40% that Apple promised, but that could vary depending on workloads (Or it could be that Apple is quoting GPU power only, while we’re measuring whole system active power here).
| GFXBench Aztec Normal Offscreen Power Efficiency (System Active Power) |
||||
| Mfc. Process | FPS | Avg. Power (W) |
Perf/W Efficiency |
|
| iPhone 11 Pro (A13) Warm | 7FFP | 73.27 | 4.07 | 18.00 fps/W |
| iPhone 11 Pro (A13) Cold / Peak | 7FFP | 91.62 | 6.08 | 15.06 fps/W |
| iPhone XS (A12) Warm | 7FF | 55.70 | 3.88 | 14.35 fps/W |
| iPhone XS (A12) Cold / Peak | 7FF | 76.00 | 5.59 | 13.59 fps/W |
| Galaxy 10+ (Snapdragon 855) | 7FF | 40.63 | 4.14 | 9.81 fps/W |
| Galaxy 10+ (Exynos 9820) | 8LPP | 40.18 | 4.62 | 8.69 fps/W |
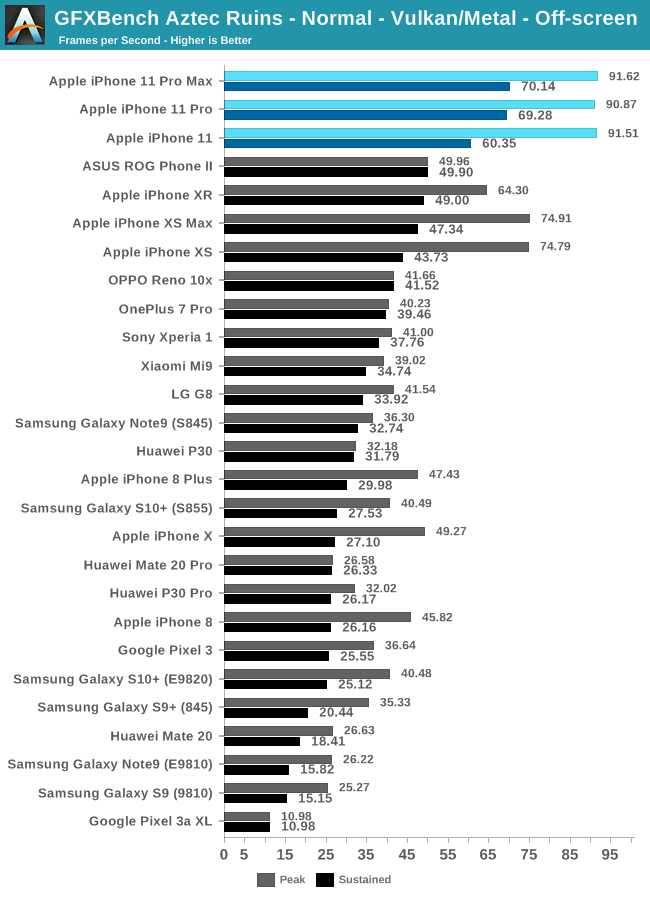
The “Normal” Aztec benchmark, which uses a lower resolution and has less workload complexity, actually fares even better for the iPhone 11s. Peak performance has improved by 21%. At roughly the same power, the A13 is 31% faster, while at almost the same performance, it’s again 32% more efficient.
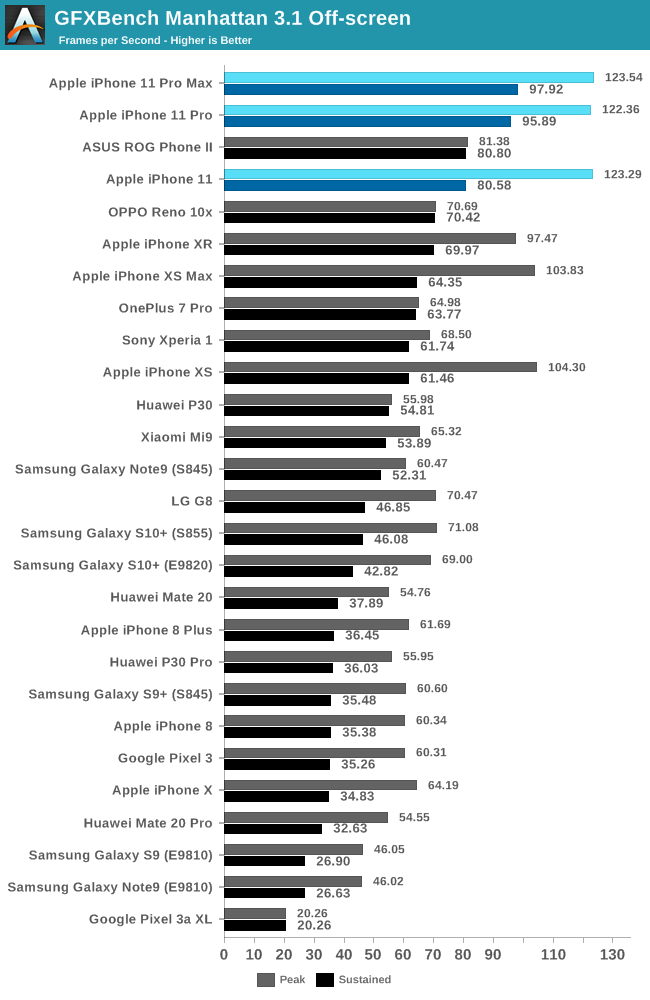
| GFXBench Manhattan 3.1 Offscreen Power Efficiency (System Active Power) |
||||
| Mfc. Process | FPS | Avg. Power (W) |
Perf/W Efficiency |
|
| iPhone 11 Pro (A13) Warm | 7FFP | 100.58 | 4.21 | 23.89 fps/W |
| iPhone 11 Pro (A13) Cold / Peak | 7FFP | 123.54 | 6.04 | 20.45 fps/W |
| iPhone XS (A12) Warm | 7FF | 76.51 | 3.79 | 20.18 fps/W |
| iPhone XS (A12) Cold / Peak | 7FF | 103.83 | 5.98 | 17.36 fps/W |
| Galaxy 10+ (Snapdragon 855) | 7FF | 70.67 | 4.88 | 14.46 fps/W |
| Galaxy 10+ (Exynos 9820) | 8LPP | 68.87 | 5.10 | 13.48 fps/W |
| Galaxy S9+ (Snapdragon 845) | 10LPP | 61.16 | 5.01 | 11.99 fps/W |
| Huawei Mate 20 Pro (Kirin 980) | 7FF | 54.54 | 4.57 | 11.93 fps/W |
| Galaxy S9 (Exynos 9810) | 10LPP | 46.04 | 4.08 | 11.28 fps/W |
| Galaxy S8 (Snapdragon 835) | 10LPE | 38.90 | 3.79 | 10.26 fps/W |
| Galaxy S8 (Exynos 8895) | 10LPE | 42.49 | 7.35 | 5.78 fps/W |
Manhattan 3.1 largely showcases similar results to the Aztec Normal scores.
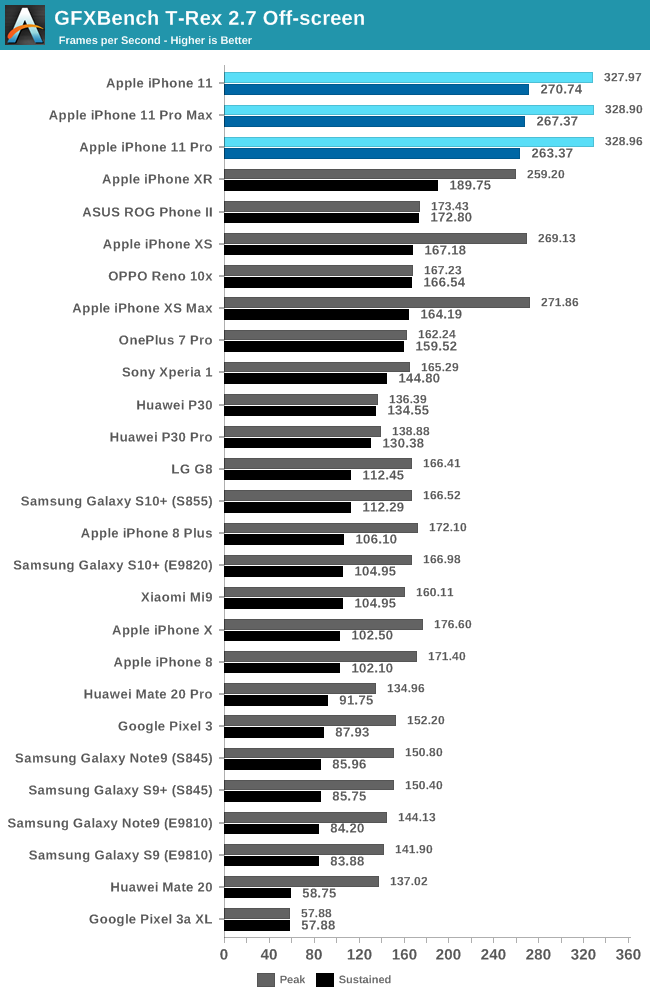
Finally, the older T-Rex benchmark has the new iPhone 11’s showcase significant improvements in terms of the sustained performance scores around 59% compared to last year’s XS devices.
| GFXBench T-Rex Offscreen Power Efficiency (System Active Power) |
||||
| Mfc. Process | FPS | Avg. Power (W) |
Perf/W Efficiency |
|
| iPhone 11 Pro (A13) Warm | 7FFP | 289.03 | 4.78 | 60.46 fps/W |
| iPhone 11 Pro (A13) Cold / Peak | 7FFP | 328.90 | 5.93 | 55.46 fps/W |
| iPhone XS (A12) Warm | 7FF | 197.80 | 3.95 | 50.07 fps/W |
| iPhone XS (A12) Cold / Peak | 7FF | 271.86 | 6.10 | 44.56 fps/W |
| Galaxy 10+ (Snapdragon 855) | 7FF | 167.16 | 4.10 | 40.70 fps/W |
| Galaxy S9+ (Snapdragon 845) | 10LPP | 150.40 | 4.42 | 34.00 fps/W |
| Galaxy 10+ (Exynos 9820) | 8LPP | 166.00 | 4.96 | 33.40fps/W |
| Galaxy S9 (Exynos 9810) | 10LPP | 141.91 | 4.34 | 32.67 fps/W |
| Galaxy S8 (Snapdragon 835) | 10LPE | 108.20 | 3.45 | 31.31 fps/W |
| Huawei Mate 20 Pro (Kirin 980) | 7FF | 135.75 | 4.64 | 29.25 fps/W |
| Galaxy S8 (Exynos 8895) | 10LPE | 121.00 | 5.86 | 20.65 fps/W |
We see the warmed up power draw for the phone here as being quite a bit higher than the other tests. It’s possible that the difference in here is the more CPU load due to the very high FPS figures we’re running the test at nowadays.
GPU Performance: Best In Class
Last year the A12 had some extremely impressive GPU improvements and it was the first time that Apple had been able to very clearly jump ahead of Qualcomm in terms of performance and efficiency. I didn't have as large expectations for the A13 this year as a follow-up, but Apple was very much able to impress and improve by greater margins than their marketing materials led me to believe.
First of all, the peak performance of the of the A13 is indeed improved by roughly ~20%. However this is not the metric that people should be paying most attention to. Apple’s sustained performance score improvements are a lot more significant and reach 50 to 60% when compared to last year’s iPhones. As things would seem, Apple’s claims to have improved thermal dissipation for the SoC have worked out extremely well.
The regular iPhone 11 does lag a bit behind the Pro models, as it seems it hasn’t been able to profit from the same design changes. Sustained performance here takes a little hit, but given the phone’s very low resolution I have to wonder if that really even matters in real workloads.
Most of all, Apple’s new GPU microarchitecture on the A13 is extremely impressive. Given the meager process node advancements, I had not expected the company to be able to push for such large performance and power efficiency gains. We’ll need to see some major paradigm shifts from the competition in order for them to be able to catch up in the next generation of devices.
Last year I did complain about the phones getting quite hot during the initial load periods at peak performance, and it looks like Apple has resolved this as I wasn’t able to measure skin temperatures above 41°C on any of the new phones. While I still question Apple’s need to drive the power draw near the limits of the power delivery of the phone, at least this time around it doesn’t create any negative drawback for the user experience.


242 Comments
View All Comments
Andrei Frumusanu - Monday, October 21, 2019 - link
The ROG2 is in the charts. It's getting good scores because it's the only S855+ phone in the charts, because the Adreno 640 has extremely high ALU performance, and because the phone itself is allowed to reach much higher temperatures than the iPhones.The benchmark *tests* are the exact same other than being run on different APIs. What's being rendered is identical between iOS and Android is the exact same.
techsorz - Monday, October 21, 2019 - link
Very nice, I think you should write that in your review. Although taking an iPhone review and then starting off with exploiting its apparent weakness on the first graph, which is the only thing most people will read, isn't very objective in my opinion. I also generally think it's better craftmanship to run benchmarks that have received updates on both devices, regardless.I mean, opening 3Dmark on the new iPhone literally starts it up in an iPhone 8 compatibiltiy mode. You can tell by how the UI doesn't even border the entire display. I just don't see a single compelling argument as to why you would ever pick this tool.
techsorz - Monday, October 21, 2019 - link
Hi Andrei, I see that you updated the review. I apologise for my harsh tone, thank you for this discussion, I learned a lot of new info.Andrei Frumusanu - Monday, October 21, 2019 - link
I updated absolutely nothing ...............techsorz - Monday, October 21, 2019 - link
Oh so you are here, why are you not addressing my point ?Andrei Frumusanu - Monday, October 21, 2019 - link
What point? The UI is irrelevant, the test is offscreen.techsorz - Monday, October 21, 2019 - link
Okay, i'll just have to quote yourself then:" I’ve actually gone back and quickly retested the iPhone XS on iOS13 and did see a 20% increase in performance compared to what we see in the graphs here; " - Andrei Frumusanu
And here is the knockout:
" the workload is running on Metal and the iOS version is irrelevant in that regard." - Andrei Frumusanu
Jesus christ, pull yourself together and fix your god damn review.
People reading, you can make your own conclusion here.
Andrei Frumusanu - Monday, October 21, 2019 - link
There is nothing to fix and there is nothing wrong with the benchmark, you went from the test being old and broken, to talking about it throttling differently because it's older, to the UI being an issue when it's completely irrelevant. The scores are what they are because that's the performance of the chip.The physics test sucks on Apple because it's one weakness in their microarchitecture: https://benchmarks.ul.com/news/understanding-3dmar...
techsorz - Monday, October 21, 2019 - link
Are you literally quoting an article from 2013 to prove something? I didn't go from anywhere, it IS old and broken. The score does NOT represent the throttling you would expect on updated software and certainly can NOT be graphed and compared with the Android version. It is BS that the app renders the same thing, you have literally 0 way of knowing since you didn't write the code.And I didn't go "herp derp, the UI is small" - I said that the app is so ancient that it literally boots in compatibility mode for the iPhone 8. And it is a real thing, go ahead and check the developer forums.
"The scores are what they are because that's the performance of the chip." ...
" I’ve actually gone back and quickly retested the iPhone XS on iOS13 and did see a 20% increase in performance compared to what we see in the graphs here; "
Comeone dude, stop it.
Andrei Frumusanu - Monday, October 21, 2019 - link
The THROTTLING has nothing to do with the software version or and GPU driver updates that Apple makes to improve performance. The improved drivers on the A12 in iOS13 do NOT change the throttling % between peak performance and sustained, which is a PHYSICAL characteristic of the phone.The workloads renders the SAME SCENE both on Android and iOS. We work closely with Futuremark, the developer of the benchmark, along with the developers of GFXBench. If you cannot accept this you have no place reading AT as I can not do anything more to convince you of basic facts regarding the testing.
The compatibility mode you blarb about is related to the UI resolution. It DOES NOT matter in any way for the test as it's been rendered off-screen in our suite. The performance results DO NOT CHANGE.
I am completely done with this topic.