Linux Desktop CPU Roundup: Cutting Edge Penguin Performance
by Kristopher Kubicki on September 19, 2004 8:00 PM EST- Posted in
- Linux
Synthetic Benchmarks
Synthetic benchmarks can still give us a good idea of what our processors should be doing. However, since they are theoretical and not good real world demonstrations of the technology, we generally rely on them only to prove or disprove if our testbeds are operating correctly. Below is the Scalar Product Opstone 04q2 as described by the author:"The 'SP' benchmark calculates the scalar product (dot product) of 2 vectors ranging in size from 16 elements to 1048576 elements for both single and double-precision floats. Although the Gflops/sec. for every vector length is recorded (in the resulting output log file), the average of all these values is reported. This benchmark is indicative of the performance of many raw floating-point data processing apps (movie format conversion, MP3 extraction, etc.)"We used the Athlon 64 binaries under SuSE x86_64, and the Pentium4 binaries under SuSE x86.
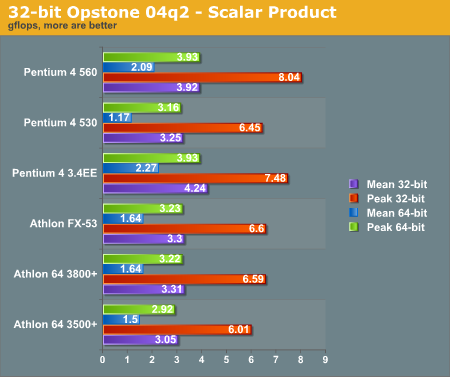
Hold your mouse over for the 64-bit graph.
Below is the SSP benchmark, as explained by the author:
"The 'ssp' benchmark also calculates the scalar product of 2 vectors, except that these vectors are sparsely populated (only the non-zero value elements are stored) ranging from a 'loading factor' (non-zero/zero elements) of 0.000001 to 0.01 for both single and double-precision floats. Since the data is not contiguous in memory, the performance is much lower than regular 'sp' and is measured in Mflops/sec. There is not much difference in performance between different loading factors as this benchmark really challenges the ability of the processor to perform short bursts of calculations coupled with lots of conditional testing. It is this reason that the P4 with its longer pipeline does not generally perform as well as the Athlon64. This benchmark is indicative of the performance of many 3D games as the processing is similar (short bursts of calculations with numerous conditional testing)"
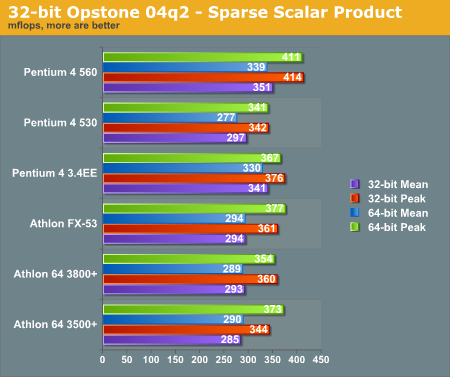
Hold your mouse over for the 64-bit graph.
The Intel processors score very high marks on our Opstone benchmarks. Unfortunately, we find that this is not entirely indicative of good performance, and in fact, the Opstone benchmark does not scale well with the rest of our test suite.


33 Comments
View All Comments
ravedave - Monday, September 20, 2004 - link
What klah is trying to say in too many and too big of words : Make the scale the same for the mouseover pics.Also make the picture height the same as well if possible.
Otherwise a very good article.
Has anyone thought of making an open office benchmark for linux?
klah - Monday, September 20, 2004 - link
Good article, but I have a comment on the mouse-over graphs. They work well in other articles such as the recent DVR-108D article where the scale and axes remain constant. In this case however the layout and in some cases even the scale are different between the two graphs. It would be easier to compare the two if the scale was the same and processors were in the same layout(spacing/location), with the inapplicable processors still listed to maintain the same appearance between the two.If that explanation is nonsensical I can create a few images to try to elucidate my point.
Decoder - Monday, September 20, 2004 - link
"Hold your mouse over for the 64-bit graph."I like to see the 32 and 64 bits on the same graph. Why not use Athlon FX-53 (32) and Athlon FX-53 (64) for labels?