USB 3.2 Gen 2 Portable SSDs Roundup - Featuring the Samsung T7 Touch and the SanDisk Extreme Pro
by Ganesh T S on January 23, 2020 9:00 AM ESTAnandTech DAS Suite - Benchmarking for Performance Consistency
Our testing methodology for DAS units takes into consideration the usual use-case for such devices. The most common usage scenario is transfer of large amounts of photos and videos to and from the unit. Other usage scenarios include the use of the DAS as a download or install location for games and importing files directly off the DAS into a multimedia editing program such as Adobe Photoshop. Some users may even opt to boot an OS off an external storage device.
The AnandTech DAS Suite tackles the first use-case. The evaluation involves processing three different workloads:
- Photos: 15.6 GB collection of 4320 photos (RAW as well as JPEGs) in 61 sub-folders
- Videos: 16.1 GB collection of 244 videos (MP4 as well as MOVs) in 6 sub-folders
- BR: 10.7 GB Blu-ray folder structure of the IDT Benchmark Blu-ray
Each workload's data set is first placed in a 25GB RAM drive, and a robocopy command is issued to transfer it to the DAS under test (formatted in NTFS). Upon completion of the transfer (write test), the contents from the DAS are read back into the RAM drive (read test). This process is repeated three times for each workload. Read and write speeds, as well as the time taken to complete each pass are recorded. Bandwidth for each data set is computed as the average of all three passes.
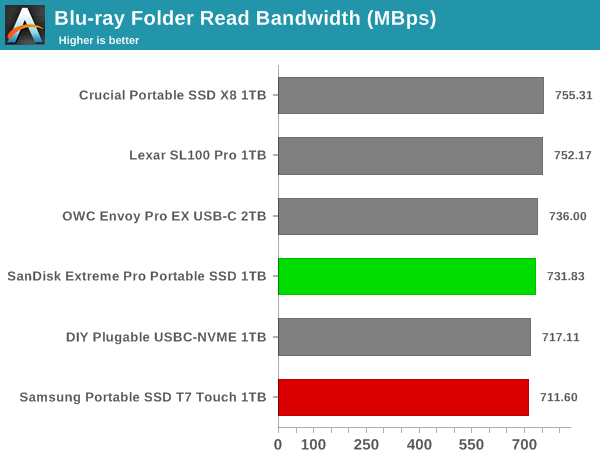
It can be seen that there is no significant gulf in the numbers between the different units. For all practical purposes, the casual user will notice no difference between them in the course of normal usage.However, power users may want to dig deeper to understand the limits of each device. To address this concern, we also instrumented our evaluation scheme for determining performance consistency.
Performance Consistency
Aspects influencing the performance consistency include SLC caching and thermal throttling / firmware caps on access rates to avoid overheating. This is important for power users, as the last thing that they want to see when copying over 100s of GB of data is the transfer rate going down to USB 2.0 speeds.
In addition to tracking the instantaneous read and write speeds of the DAS when processing the AnandTech DAS Suite, the temperature of the drive was also recorded at the beginning and end of the processing. In earlier reviews, we used to track the temperature all through. However, we have observed that SMART read-outs for the temperature in NVMe SSDs using USB 3.2 Gen 2 bridge chips end up negatively affecting the actual transfer rates. To avoid this problem, we have restricted ourselves to recording the temperature at either end of the actual workloads set. The graphs below present the recorded data.
| Performance Consistency and Thermal Characteristics |
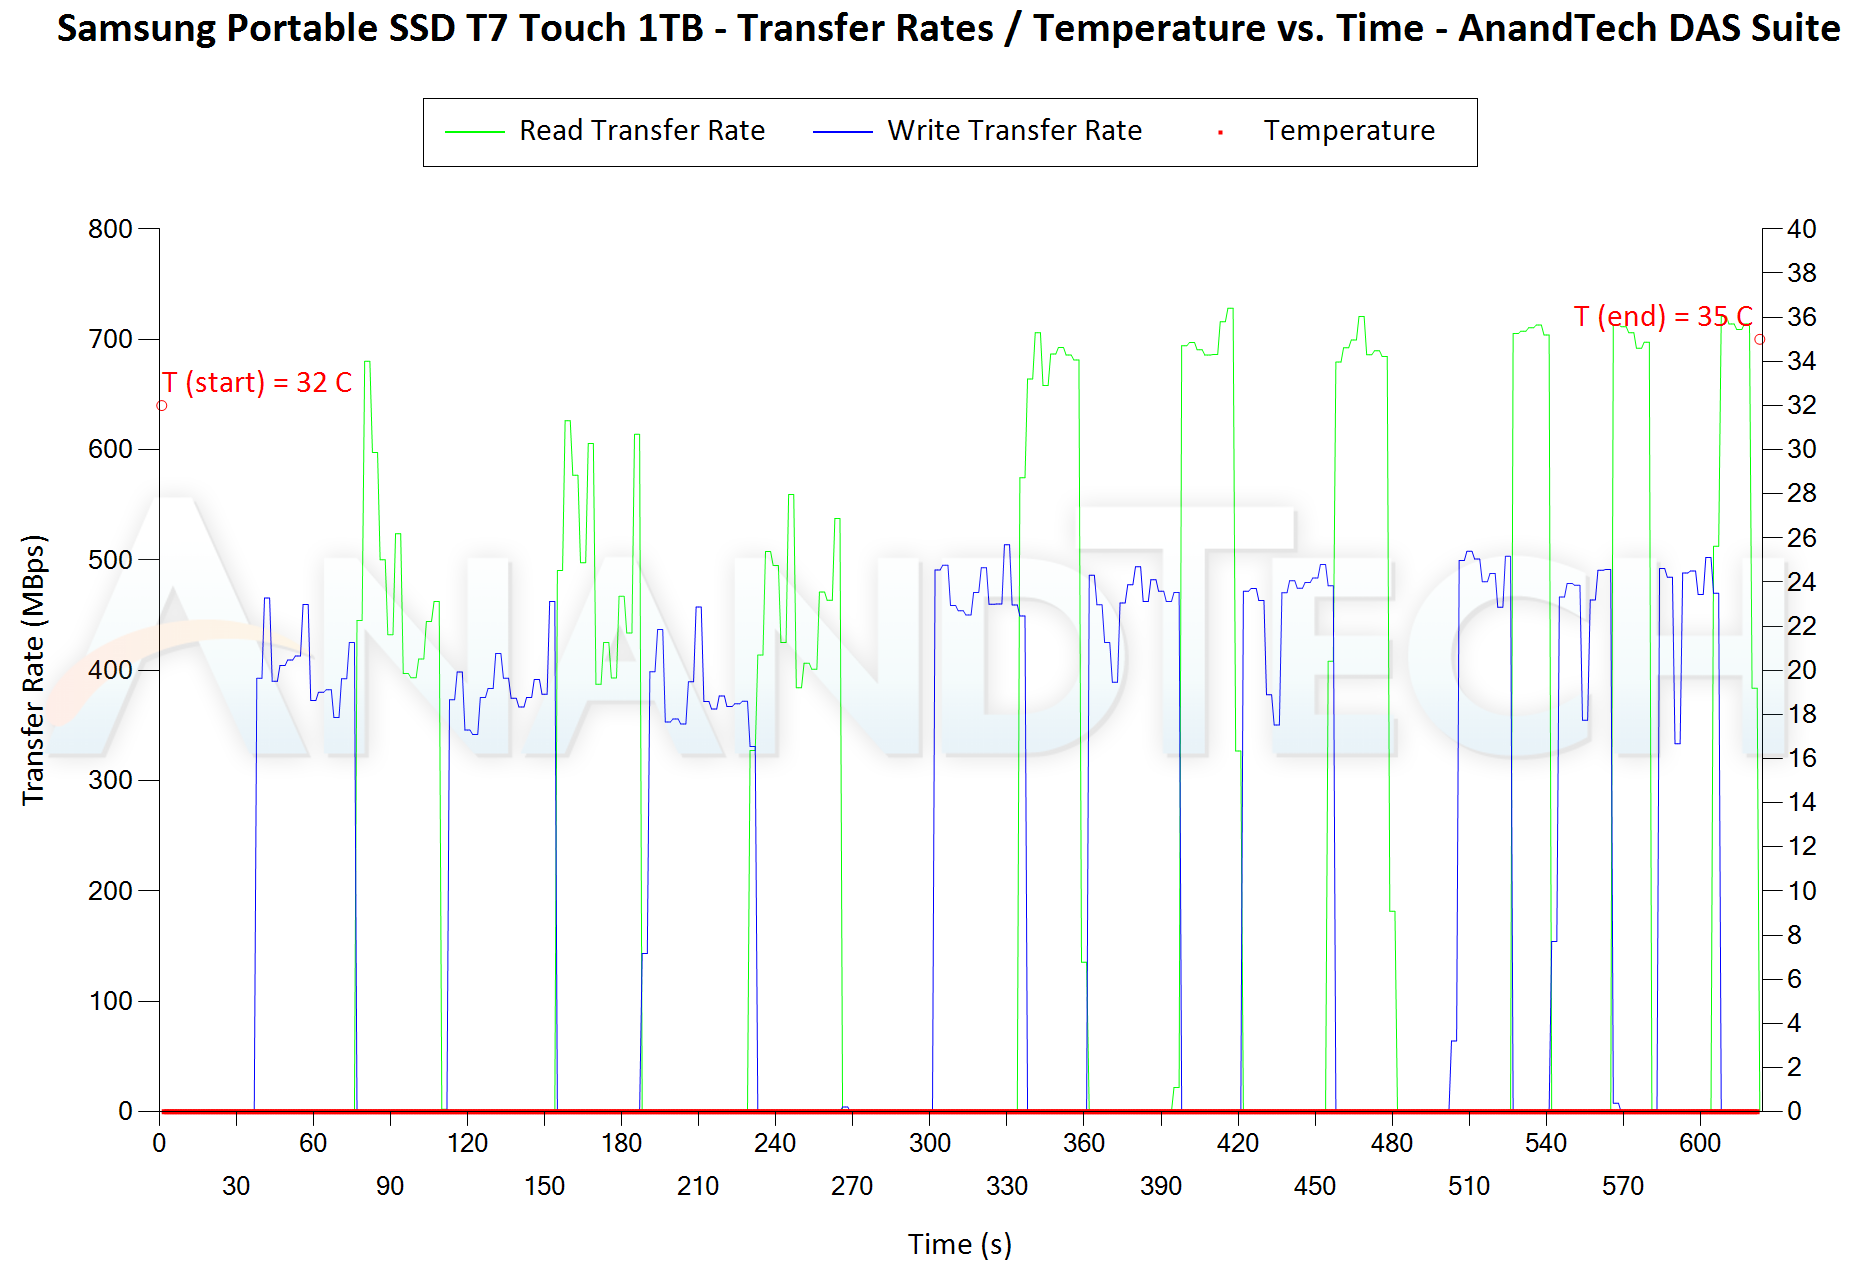 |
The first three sets of writes and reads correspond to the photos suite. A small gap (for the transfer of the video suite from the internal SSD to the RAM drive) is followed by three sets for the video suite. Another small RAM-drive transfer gap is followed by three sets for the Blu-ray folder. An important point to note here is that each of the first three blue and green areas correspond to 15.6 GB of writes and reads respectively. Of all the tested drives, only the Crucial Portable SSD X8 hiccups a little during certain writes. Temperature-wise, the OWC Envoy Pro EX USB-C and the Samsung T7 Touch both show only a 3C increase in temperature on eithe side of the workload. On the other hand, the Lexar SL100 Pro shows a significant 11C increase, pointing to possible thermal issues in the long run.


38 Comments
View All Comments
13Gigatons - Wednesday, January 29, 2020 - link
I can't believe how stupid their marketing department is...who's naming this stuff?How about: USB 5 and USB 10 and USB 20 and USB 40
regsEx - Thursday, January 30, 2020 - link
There shouldn't be any Gen 1, Gen 1x1, Gen 2, Gen 2x1, SS, SS10, SS20. There should have been only USB 3.0, USB 3.1 and USB 3.2.USB Group does it on purpose. To fool people into new shiny numbers.
regsEx - Thursday, January 30, 2020 - link
There shouldn't be any Gen 1, Gen 1x1, Gen 2, Gen 2x1, Gen 2x2, SS, SS10, SS20*Chrestos SV1GAP - Tuesday, March 10, 2020 - link
The same problem exists with SD cards. After classes 2, 4 ,6, 10 there should be classes 30, 60, 90. Instead of that, there are 3 different names for the class 10 and 2 different names for the classes 6 and 30. https://www.sdcard.org/developers/overview/speed_c...Eliadbu - Tuesday, January 28, 2020 - link
By the drive speeds I guess it's USB 3.2 gen 2x1 and not gen 2x2 (thanks for the simple naming scheme USB-IF) also makes wonder why there is around 15-20% overhead of the maximum connection speed ( I know it exits in other connections like SATA for example but I wonder why it is so high)amnesia0287 - Thursday, April 9, 2020 - link
They all seemed to use the same usb chip, so probably that is it’s max speed.Leo222 - Wednesday, March 4, 2020 - link
Interested in the topic, decided to read, found the first site: https://www.bestadvisor.com/external-solid-state-d...And here they write: However, the WD My Passport SSD is uniquely compatible with pretty much all generations of computers. Since it uses the USB 3.1 Gen-2 interface
It's like the media is truth mixed with fiction, I think it was invented only in order to attract attention and money
Chrestos SV1GAP - Tuesday, March 10, 2020 - link
@ Author, Ganesh T SPage 6: "USB 2.0 ports are guaranteed to deliver only 4.5W (900mA @ 5V)".
You mean "USB 3.0".