The AMD Ryzen 5 2500X and Ryzen 3 2300X CPU Review
by Ian Cutress on February 11, 2019 11:45 AM ESTCPU Performance: Office Tests
The Office test suite is designed to focus around more industry standard tests that focus on office workflows, system meetings, some synthetics, but we also bundle compiler performance in with this section. For users that have to evaluate hardware in general, these are usually the benchmarks that most consider.
All of our benchmark results can also be found in our benchmark engine, Bench.
PCMark 10: Industry Standard System Profiler
Futuremark, now known as UL, has developed benchmarks that have become industry standards for around two decades. The latest complete system test suite is PCMark 10, upgrading over PCMark 8 with updated tests and more OpenCL invested into use cases such as video streaming.
PCMark splits its scores into about 14 different areas, including application startup, web, spreadsheets, photo editing, rendering, video conferencing, and physics. We post all of these numbers in our benchmark database, Bench, however the key metric for the review is the overall score.
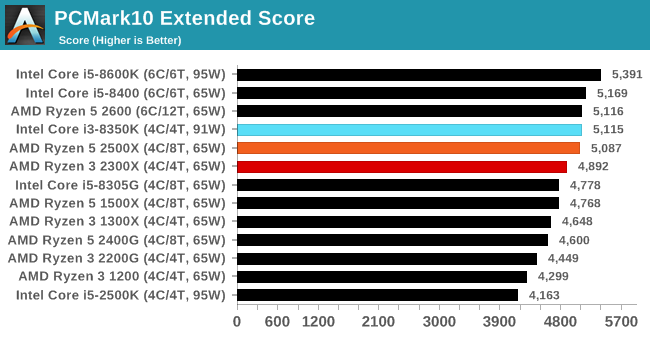
PCMark likes a lot of single threaded performance, and the quad-core Core i3 matches the eight-thread AMD, with the quad-thread AMD just slightly behind.
Chromium Compile: Windows VC++ Compile of Chrome 56
A large number of AnandTech readers are software engineers, looking at how the hardware they use performs. While compiling a Linux kernel is ‘standard’ for the reviewers who often compile, our test is a little more varied – we are using the windows instructions to compile Chrome, specifically a Chrome 56 build from March 2017, as that was when we built the test. Google quite handily gives instructions on how to compile with Windows, along with a 400k file download for the repo.
In our test, using Google’s instructions, we use the MSVC compiler and ninja developer tools to manage the compile. As you may expect, the benchmark is variably threaded, with a mix of DRAM requirements that benefit from faster caches. Data procured in our test is the time taken for the compile, which we convert into compiles per day.
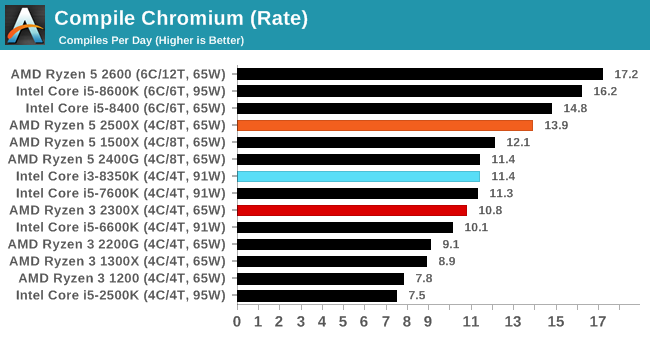
In our compile test, the higher thread count of the 2500X gives it a good lead over the other two comparison points, although the 2300X is only slightly behind the Core i3 here.
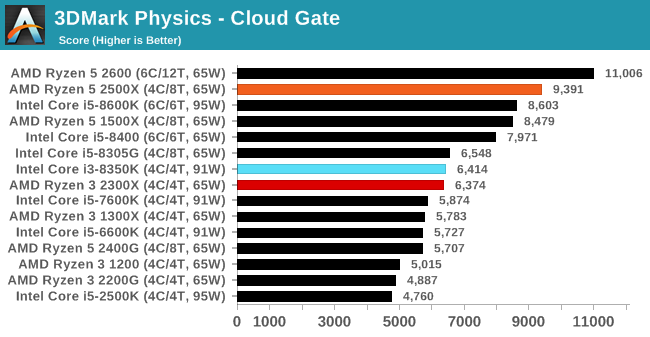
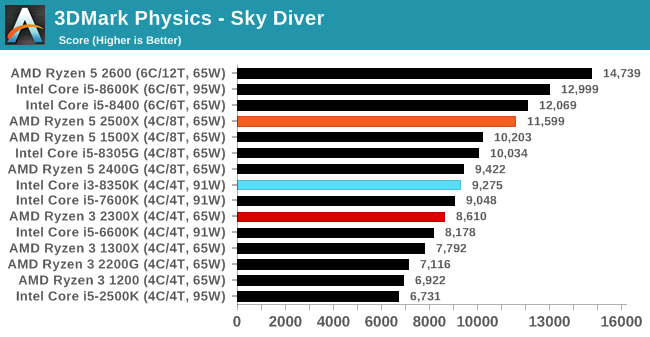
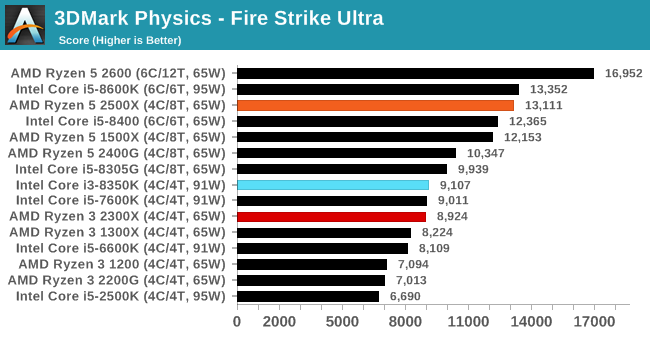
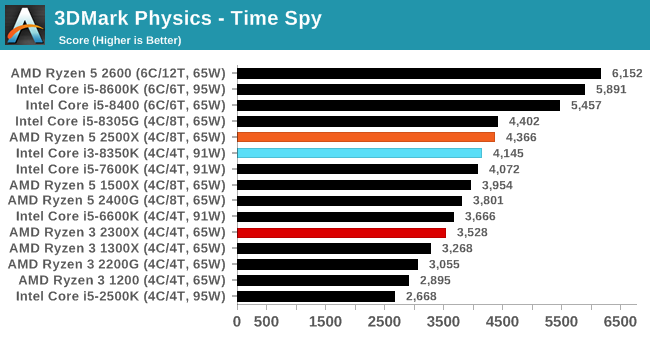
3DMark Physics: In-Game Physics Compute
Alongside PCMark is 3DMark, Futuremark’s (UL’s) gaming test suite. Each gaming tests consists of one or two GPU heavy scenes, along with a physics test that is indicative of when the test was written and the platform it is aimed at. The main overriding tests, in order of complexity, are Ice Storm, Cloud Gate, Sky Diver, Fire Strike, and Time Spy.
Some of the subtests offer variants, such as Ice Storm Unlimited, which is aimed at mobile platforms with an off-screen rendering, or Fire Strike Ultra which is aimed at high-end 4K systems with lots of the added features turned on. Time Spy also currently has an AVX-512 mode (which we may be using in the future).
For our tests, we report in Bench the results from every physics test, but for the sake of the review we keep it to the most demanding of each scene: Cloud Gate, Sky Diver, Fire Strike Ultra, and Time Spy.
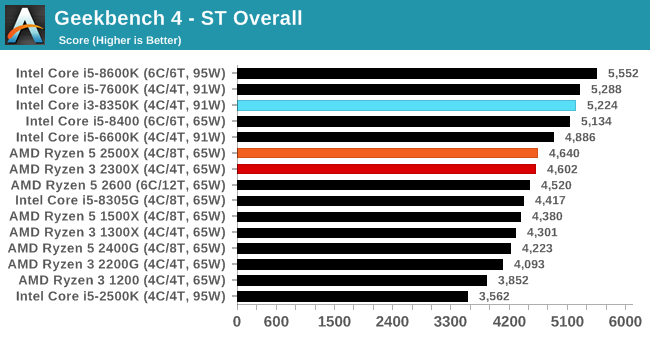
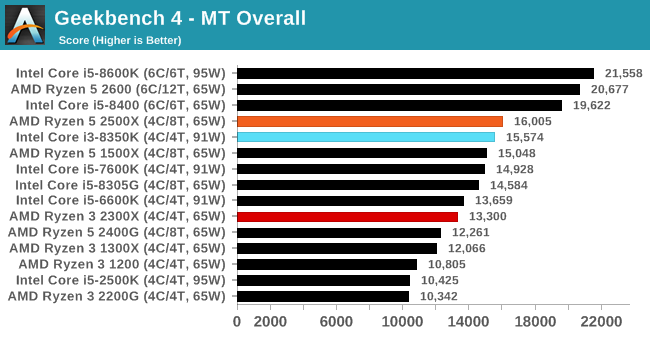
GeekBench4: Synthetics
A common tool for cross-platform testing between mobile, PC, and Mac, GeekBench 4 is an ultimate exercise in synthetic testing across a range of algorithms looking for peak throughput. Tests include encryption, compression, fast Fourier transform, memory operations, n-body physics, matrix operations, histogram manipulation, and HTML parsing.
I’m including this test due to popular demand, although the results do come across as overly synthetic, and a lot of users often put a lot of weight behind the test due to the fact that it is compiled across different platforms (although with different compilers).
We record the main subtest scores (Crypto, Integer, Floating Point, Memory) in our benchmark database, but for the review we post the overall single and multi-threaded results.


65 Comments
View All Comments
Le Québécois - Monday, February 11, 2019 - link
Ian, any reason why more often than not, you seem to "skip" 1440 in your benchmarks? It's only present for a few games.Considering the GTX 1080, your best card, is always the bottleneck at 4K, as your numbers show, wouldn't it make more sense to focus more on 1440 instead?
Especially considering it's the "best" resolution on the market if you are looking for a high pixel density yet still want to run your games at a playable levels of fps.
Ian Cutress - Monday, February 11, 2019 - link
Some benchmarks are run at 1440p. Some go up to 8K. It's a mix. There's what, 10 games there? Not all of them have to conform to the same testing settings.Le Québécois - Tuesday, February 12, 2019 - link
Sorry for the confusion. I can clearly see we've got very different settings in that mix. I guess a more direct question would be: why do it this way and not with a more standardized series of test?A followup question would also be, why 8K? You are already GPU limited at 4K so your 8K result are not going to give any relevant information about those CPUs.
Sorry, I don't mean to criticized, I simply wish to understand your thought process.
MrSpadge - Monday, February 11, 2019 - link
What exactly do you want to see there that you can't see at 1080p? Differences between CPUs are going to be muddied due to approaching the GPU limit, and that's it.Le Québécois - Tuesday, February 12, 2019 - link
Well, at 1080, you can definitely see the difference between them, and exactly like you said, at 4K, it's all the same because of the GPU limitations. 1440 seems more relevant than 4K considering this. This is after all, a CPU review and most of the 4K results could be summed up by "they all perform within a few %".neblogai - Monday, February 11, 2019 - link
End of page 19: R5 2600 is really 65W TDP, not 95W.Ian Cutress - Monday, February 11, 2019 - link
Doh, a typo in all my graphs too. Should be updated.imaheadcase - Monday, February 11, 2019 - link
Im on phone on AT and truly see how terrible ads are now. AT straight up letting scam ads now being served because desperate for revenue. 😂PeachNCream - Monday, February 11, 2019 - link
Is there a point in even mentioning that give how little control they now have over advertising? Just fire up the ad blocker or visit another site and let the new owners figure it out the hard way.StevoLincolnite - Tuesday, February 12, 2019 - link
Anandtech had Maleware/Viruses infect it's userbase years ago via crappy adverts.That was the moment I got Ad-Block. And that is the moment where I will never turn it off again.