Tiny at $200: ASUS Z390-I Gaming vs. ASRock Z390 Gaming-ITX/ac Review
by Gavin Bonshor on February 12, 2019 10:00 AM ESTSystem Performance
Not all motherboards are created equal. On the face of it, they should all perform the same and differ only in the functionality they provide - however, this is not the case. The obvious pointers are power consumption, but also the ability for the manufacturer to optimize USB speed, audio quality (based on audio codec), POST time and latency. This can come down to manufacturing process and prowess, so these are tested.
For Z390 we are running an updated version of our test suite, including OS and CPU cooler. This has some effect on our results.
Power Consumption
Power consumption was tested on the system while in a single ASUS GTX 980 GPU configuration with a wall meter connected to the Thermaltake 1200W power supply. This power supply has ~75% efficiency > 50W, and 90%+ efficiency at 250W, suitable for both idle and multi-GPU loading. This method of power reading allows us to compare the power management of the UEFI and the board to supply components with power under load, and includes typical PSU losses due to efficiency. These are the real world values that consumers may expect from a typical system (minus the monitor) using this motherboard.
While this method for power measurement may not be ideal, and you feel these numbers are not representative due to the high wattage power supply being used (we use the same PSU to remain consistent over a series of reviews, and the fact that some boards on our test bed get tested with three or four high powered GPUs), the important point to take away is the relationship between the numbers. These boards are all under the same conditions, and thus the differences between them should be easy to spot.
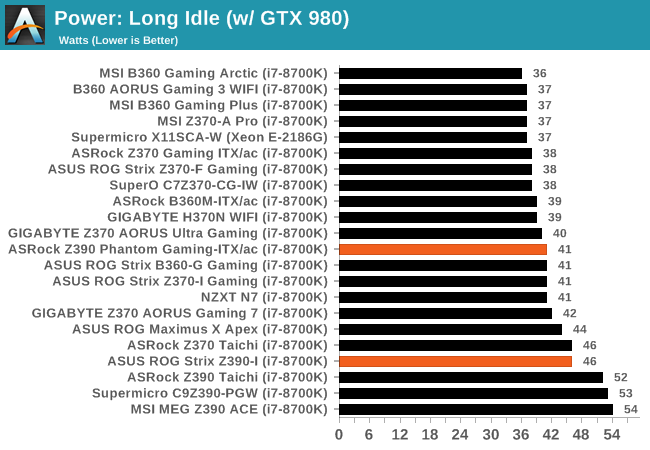
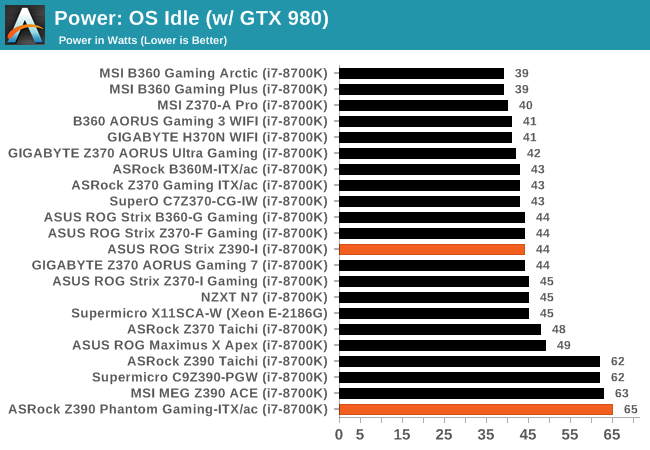
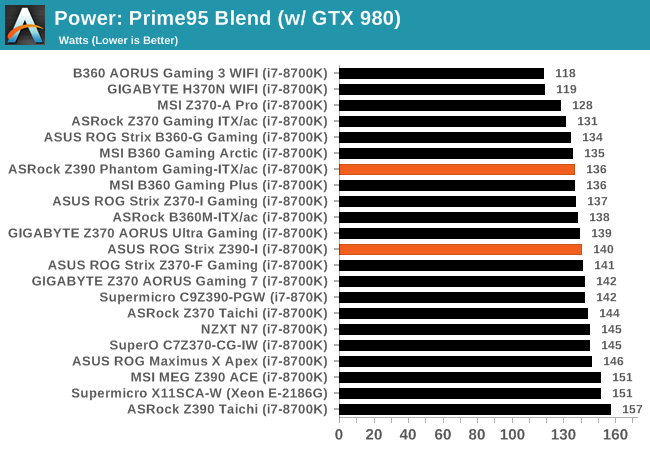
In a long idle power state, both the ASUS ROG Strix Z390-I Gaming and ASRock Z390 Phantom Gaming-ITX/ac perform well, however in an OS idle state, the Phantom Gaming board was very power hungry; the hungriest so far in our Z390 tests. At full load, both boards both performed competitively within 3% of each other and sit towards the middle of our graphs.
Non-UEFI POST Time
Different motherboards have different POST sequences before an operating system is initialized. A lot of this is dependent on the board itself, and POST boot time is determined by the controllers on board (and the sequence of how those extras are organized). As part of our testing, we look at the POST Boot Time using a stopwatch. This is the time from pressing the ON button on the computer to when Windows starts loading. (We discount Windows loading as it is highly variable given Windows specific features.)
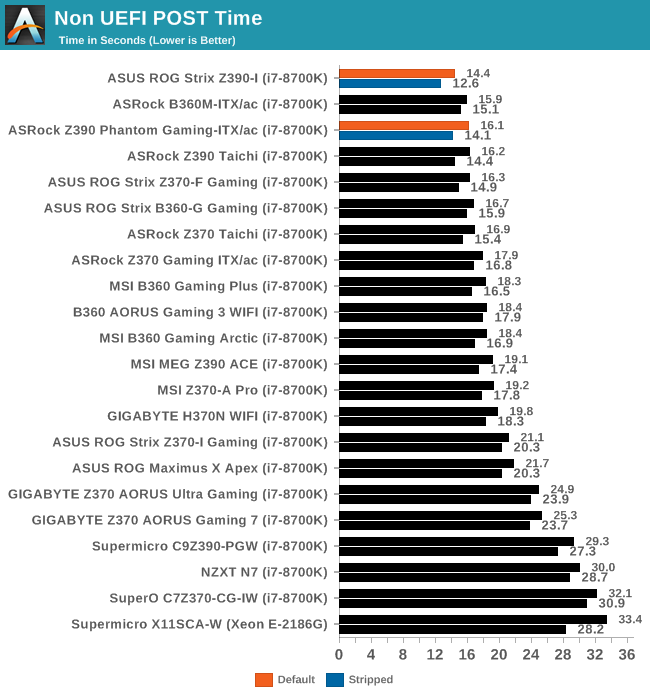
The ASUS ROG Strix Z390-I Gaming managed to record the fastest POST time from any of the LGA1151 motherboards tested so far, both at stock settings and with controllers disabled. Just behind it is the ASRock Z390 Phantom Gaming-ITX/ac by a couple of seconds, but still ahead of most of the boards previously tested.
DPC Latency
Deferred Procedure Call latency is a way in which Windows handles interrupt servicing. In order to wait for a processor to acknowledge the request, the system will queue all interrupt requests by priority. Critical interrupts will be handled as soon as possible, whereas lesser priority requests such as audio will be further down the line. If the audio device requires data, it will have to wait until the request is processed before the buffer is filled.
If the device drivers of higher priority components in a system are poorly implemented, this can cause delays in request scheduling and process time. This can lead to an empty audio buffer and characteristic audible pauses, pops and clicks. The DPC latency checker measures how much time is taken processing DPCs from driver invocation. The lower the value will result in better audio transfer at smaller buffer sizes. Results are measured in microseconds.
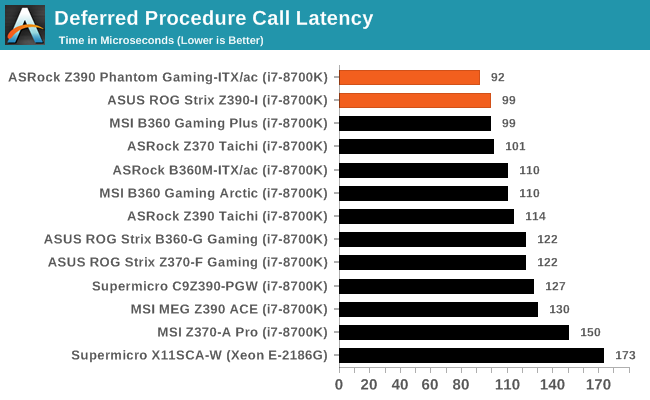
Not a single of the LGA1151 models we've tested thus far has been optimized for DPC latency, but both the mini-ITX sized boards on test managed to perform better than the rest of the pack. The Z390 Phantom Gaming-ITX/ac came out on top with the Strix Z390-I Gaming not too far behind.


26 Comments
View All Comments
IKonev - Wednesday, February 13, 2019 - link
Re: TB3 comments, it evidently runs up to a max of half of the rate bandwidth (so, 20GB/s) using only 2 PCIe 3.0 lanes as opposed to the regular 4 lanes - here's what Tweaktown had to say:"Thunderbolt 3 is from the Intel JHL6240 Thunderbolt 3 controller; it's a low power 1.2W single port part that connects to the chipset through two PCI-E 3.0 lanes."
And yes, TB3 ports can effectively be used as USB ports, but the transfer speeds will max out at that of the cable & device plugged into the port.
romrunning - Wednesday, February 13, 2019 - link
Thanks for the helpful info! Maybe this review can be updated with that info.Dug - Wednesday, February 13, 2019 - link
I can't wait for motherboard reviews that go into what the motherboard actually does besides gaming benchmarks.I do like the power and boot times included, but really things like thunderbolt, usb, wifi, sound, memory, and storage (both sata and m.2) should all be tested. This is what makes or breaks a motherboard.
timecop1818 - Wednesday, February 13, 2019 - link
Also interesting to know what chipset handles HDMI2 conversion. Intel CPUs only support DisplayPort...hanselltc - Thursday, February 14, 2019 - link
asrock all day. that plastic shroud is soooooooooo ugly, and asrock has hratsinks instead.niemi - Wednesday, February 20, 2019 - link
Gavin, which program do you use to measure DPC latency?Is it idle or load numbers, and for how long do you run the test?
Any chance of a ‘highest measured’ or a curve over time as a supplement to the median? That would help when comparing for spikes.