The Enterpise TLC Storage Era Begins: Rounding Up 13 SSDs With Samsung, Intel, and Memblaze
by Billy Tallis on January 3, 2019 9:45 AM ESTMixed Random Performance
Real-world storage workloads usually aren't pure reads or writes but a mix of both. It is completely impractical to test and graph the full range of possible mixed I/O workloads—varying the proportion of reads vs writes, sequential vs random and differing block sizes leads to far too many configurations. Instead, we're going to focus on just a few scenarios that are most commonly referred to by vendors, when they provide a mixed I/O performance specification at all. We tested a range of 4kB random read/write mixes at queue depth 32, and also tested the NVMe drives at QD128. This gives us a good picture of the maximum throughput these drives can sustain for mixed random I/O, but in many cases the queue depth will be far higher than necessary, so we can't draw meaningful conclusions about latency from this test. As with our tests of pure random reads or writes, we are using 32 (or 128) threads each issuing one read or write request at a time. This spreads the work over many CPU cores, and for NVMe drives it also spreads the I/O across the drive's several queues.
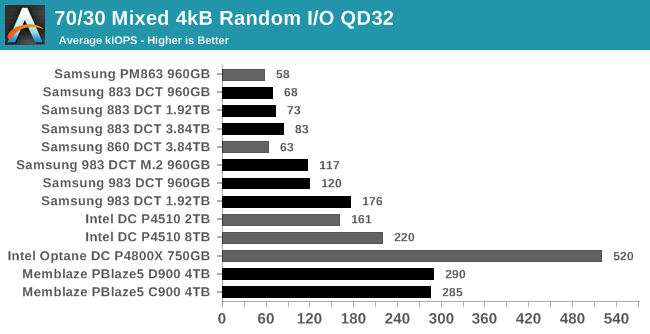
The full range of read/write mixes is graphed below, but we'll primarily focus on the 70% read, 30% write case that is a fairly common stand-in for moderately read-heavy mixed workloads.
 |
|||||||||
| Queue Depth 32 | Queue Depth 128 | ||||||||
The SATA SSDs are all significantly slower at 70% reads than they were at 100% reads on the previous page, but the higher capacity drives come closer to saturating the SATA link. Among the NVMe drives, the Samsung 983 DCT shows no further improvement from increasing the queue depth from 32 all the way to 128, but the more powerful NVMe drives do need the higher queue depth to deliver full speed. The Intel P4510's improvement at QD128 over QD32 is relatively modest, but the Memblaze PBlaze5 almost doubles its throughput and manages to catch up to the Intel Optane P4800X.
 |
|||||||||
| QD32 Power Efficiency in MB/s/W | QD32 Average Power in W | ||||||||
| QD128 Power Efficiency in MB/s/W | QD128 Average Power in W | ||||||||
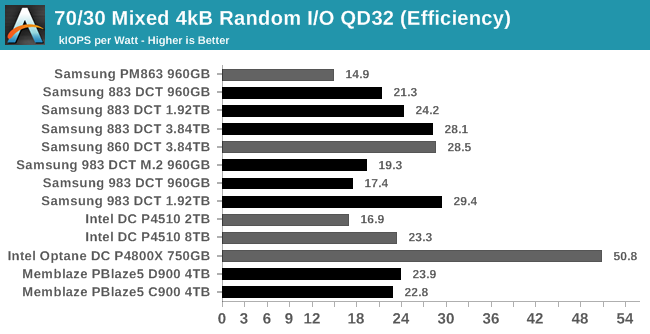
The Intel Optane P4800X is the only drive that stands out with a clear power efficiency advantage; aside from that, the different product segments are on a relatively equal footing. The different capacities within each product line all have similar power draw, so the largest (fastest) models end up with the best efficiency scores. The smaller NVMe drives like the 960GB Samsung 983 DCT and the 2TB Intel P4510 waste some of the performance potential of their SSD controllers, so from a power efficiency standpoint only the larger NVMe drives are competitive with the SATA drives.
 |
|||||||||
| QD32 | |||||||||
| QD128 | |||||||||
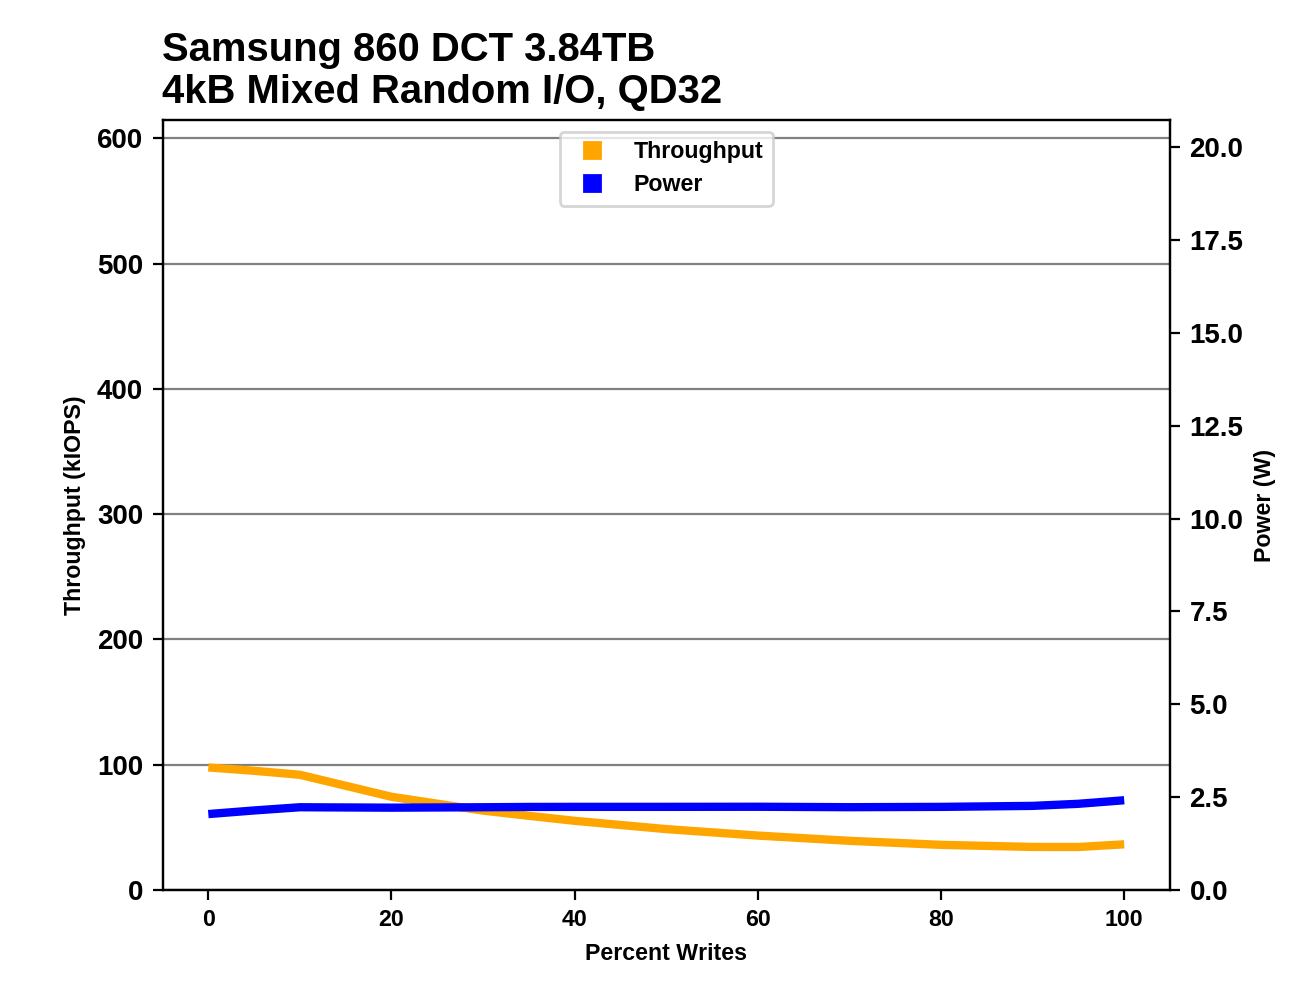
The SATA drives and slower NVMe drives generally show a steep decline in performance as the test progresses from pure reads through the more read-heavy mixes, accompanied by a increase in power consumption. For the more balanced mixes and the more write-heavy half of the test, those drives show slower performance decline and power consumption plateaus. For the faster NVMe drives (the Memblaze PBlaze5 and Intel Optane P4800X), power consumption climbs through most or all of the test, and they are the only drives for which increasing the queue depth beyond 32 helps on the more balanced or write-heavy mixes. Higher queue depths only help the Samsung 983 DCT and Intel P4510 for the most ready-heavy workloads.
Aerospike Certification Tool
Aerospike is a high-performance NoSQL database designed for use with solid state storage. The developers of Aerospike provide the Aerospike Certification Tool (ACT), a benchmark that emulates the typical storage workload generated by the Aerospike database. This workload consists of a mix of large-block 128kB reads and writes, and small 1.5kB reads. When the ACT was initially released back in the early days of SATA SSDs, the baseline workload was defined to consist of 2000 reads per second and 1000 writes per second. A drive is considered to pass the test if it meets the following latency criteria:
- fewer than 5% of transactions exceed 1ms
- fewer than 1% of transactions exceed 8ms
- fewer than 0.1% of transactions exceed 64ms
Drives can be scored based on the highest throughput they can sustain while satisfying the latency QoS requirements. Scores are normalized relative to the baseline 1x workload, so a score of 50 indicates 100,000 reads per second and 50,000 writes per second. Since this test uses fixed IO rates, the queue depths experienced by each drive will depend on their latency, and can fluctuate during the test run if the drive slows down temporarily for a garbage collection cycle. The test will give up early if it detects the queue depths growing excessively, or if the large block IO threads can't keep up with the random reads.
We used the default settings for queue and thread counts and did not manually constrain the benchmark to a single NUMA node, so this test produced a total of 64 threads scheduled across all 72 virtual (36 physical) cores.
The usual runtime for ACT is 24 hours, which makes determining a drive's throughput limit a long process. For fast NVMe SSDs, this is far longer than necessary for drives to reach steady-state. In order to find the maximum rate at which a drive can pass the test, we start at an unsustainably high rate (at least 150x) and incrementally reduce the rate until the test can run for a full hour, and the decrease the rate further if necessary to get the drive under the latency limits.
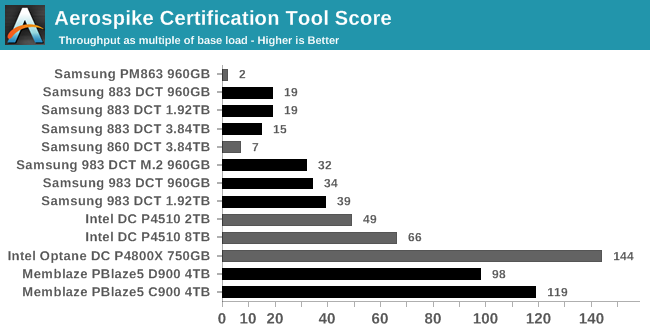
Samsung's SATA drives have vastly improved performance over the older PM863—even the entry-level 860 DCT is several times faster, and it's absolutely not intended for workloads that are this write-heavy. The 3.84TB 883 DCT is a bit slower than the lower capacities, but still offers more than twice the performance of the 860 DCT.
The NVMe drives all outperform the SATA drives, with the Samsung 983 DCT M.2 predictably being the slowest of the bunch. The Intel P4510 outperforms the 983 DCTs, and the Memblaze PBlaze5s are much faster still, though even the PBlaze5 C900 can't quite catch up to the Intel Optane DC P4800X.
 |
|||||||||
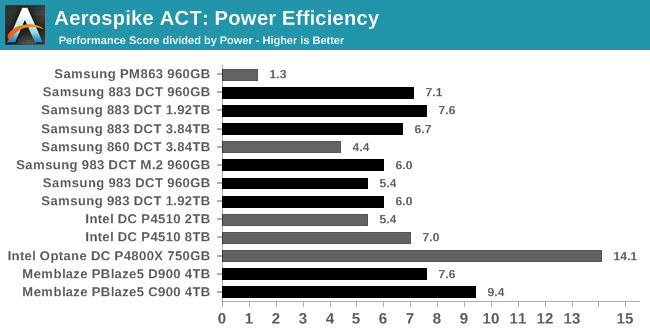
| Power Efficiency | Average Power in W | ||||||||
The power consumption differences between these drives span almost an order of magnitude. The latest Samsung SATA drives range from 1.6 W up to 2.7 W, while the NVMe drives start at 5.3 W for the 983 DCT M.2 and go up to 12.9 W for the PBlaze 5. However, the power efficiency scores don't vary as much. The two fastest NVMe SSDs also take the two highest efficiency scores, but then the Samsung 883 DCT SATA drives offer better efficiency than most of the rest of the NVMe drives. The SATA drives are at a serious disadvantage in terms of IOPS/TB, but for large datasets the SATA drives might offer adequate performance in aggregate at a lower TCO.


36 Comments
View All Comments
ZeDestructor - Friday, January 4, 2019 - link
Could you do the MemBlaze drives too? I'm really curious how those behave under consumer workloads.mode_13h - Thursday, January 3, 2019 - link
At 13 ms, the Peak 4k Random Read (Latency) chart is likely showing the overhead of a pair of context switches for 3 of those drives. I'd be surprised if that result were reproducible.Billy Tallis - Thursday, January 3, 2019 - link
Those tail latencies are the result of far more than just a pair of context switches. The problem with those three drives is that they need really high queue depths to reach full throughput. Since that test used many threads each issuing one IO at a time, tail latencies get much worse once the number of threads outnumbers the number of (virtual) cores. The 64-thread latencies are reasonable, but the 99.9th and higher percentiles are many times worse for the 96+ thread iterations of the test. (The machine has 72 virtual cores.)The only way to max out those drive's throughput while avoiding the thrashing of too many threads is to re-write an application to use fewer threads that are issuing IO requests in batches with asynchronous APIs. That's not always an easy change to make in the real world, and for benchmarking purposes it's an extra variable that I didn't really want to dig into for this review (especially given how it complicates measuring latency).
I'm comfortable with some of the results being less than ideal as a reflection of how the CPU can sometimes bottleneck the fastest SSDs. Optimizing the benchmarks to reduce CPU usage doesn't necessarily make them more realistic.
CheapSushi - Friday, January 4, 2019 - link
Hey Billy. this is a bit of a tangent but do you think SSHDs will have any kind of resurgence? There hasn't been a refresh at all. The 2.5" SSHDs max out at about 2TB I believe with 8GB of MLC(?) NAND. Now that QLC is being pushed out and with fairly good SLC schemes, do you think SSHDs could still fill a gap in price + capacity + performance? Say, at least a modest bump to 6TB of platter with 128GB of QLC/SLC-turbo NAND? Or some kind of increase along those lines? I know most folks don't care about them anymore. But there's still something appealing to me about the combination.leexgx - Friday, January 4, 2019 - link
Sshd tend to use MLC, Only ones been interesting has been the Toshiba second gen sshds as they use some of the 8gb for write caching (from some Basic tests I have seen)where as seagate only caches commonly read locations
leexgx - Friday, January 4, 2019 - link
Very annoying the page reloadingWant to test second gen Toshiba but finding the right part number as they are using creptic part numbers
CheapSushi - Friday, January 4, 2019 - link
Ah, I was not aware of the ones from Toshiba, thanks for the heads up. Write caching seems the way to go for such a setup. Did the WD SSHD's do the same as Seagates?leexgx - Friday, January 11, 2019 - link
I have obtained the Toshiba mq01, mq02 and there h200 sshd all 500gb to test to see if write caching works (limit testing to 500mb writing at start see how it goes from Therethiagotech - Friday, January 4, 2019 - link
Can someone help me understanding which scenarios is considered as QD1 and higher? Does anyone have a guide for dummies what is queue depth? Lets suppose i'll start Windows and there is 200 files of 4k, is it a QD1 or QD64? Because i was copying a folder with a large number of tiny files and my Samsung 960 Pro reached like 70MBPS of copy speed, is really bad number...Greg100 - Saturday, January 5, 2019 - link
thiagotech,About queue depth during boot up a Windows check last post: https://forums.anandtech.com/threads/qd-1-workload...
About optimization Samsung 960 Pro performance check: "The SSD Reviewers Guide to SSD Optimization 2018" on thessdreview