The $60 CPU Question: AMD Athlon 200GE or Intel Pentium Gold G5400? A Review
by Ian Cutress on January 14, 2019 8:00 AM ESTCPU Performance: Encoding Tests
With the rise of streaming, vlogs, and video content as a whole, encoding and transcoding tests are becoming ever more important. Not only are more home users and gamers needing to convert video files into something more manageable, for streaming or archival purposes, but the servers that manage the output also manage around data and log files with compression and decompression. Our encoding tasks are focused around these important scenarios, with input from the community for the best implementation of real-world testing.
All of our benchmark results can also be found in our benchmark engine, Bench.
Handbrake 1.1.0: Streaming and Archival Video Transcoding
A popular open source tool, Handbrake is the anything-to-anything video conversion software that a number of people use as a reference point. The danger is always on version numbers and optimization, for example the latest versions of the software can take advantage of AVX-512 and OpenCL to accelerate certain types of transcoding and algorithms. The version we use here is a pure CPU play, with common transcoding variations.
We have split Handbrake up into several tests, using a Logitech C920 1080p60 native webcam recording (essentially a streamer recording), and convert them into two types of streaming formats and one for archival. The output settings used are:
- 720p60 at 6000 kbps constant bit rate, fast setting, high profile
- 1080p60 at 3500 kbps constant bit rate, faster setting, main profile
- 1080p60 HEVC at 3500 kbps variable bit rate, fast setting, main profile
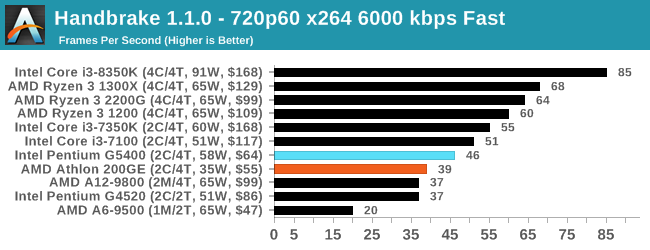

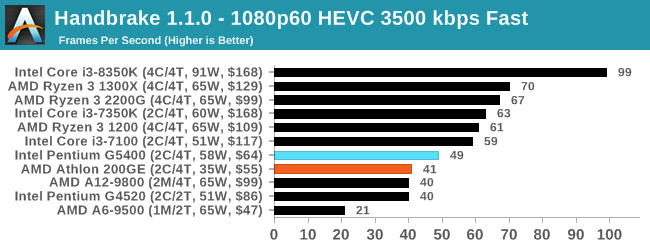
Handbrake manages to use the Pentium resources and higher frequency better, scoring about a 15% win in every circumstance.
7-zip v1805: Popular Open-Source Encoding Engine
Out of our compression/decompression tool tests, 7-zip is the most requested and comes with a built-in benchmark. For our test suite, we’ve pulled the latest version of the software and we run the benchmark from the command line, reporting the compression, decompression, and a combined score.
It is noted in this benchmark that the latest multi-die processors have very bi-modal performance between compression and decompression, performing well in one and badly in the other. There are also discussions around how the Windows Scheduler is implementing every thread. As we get more results, it will be interesting to see how this plays out.
Please note, if you plan to share out the Compression graph, please include the Decompression one. Otherwise you’re only presenting half a picture.
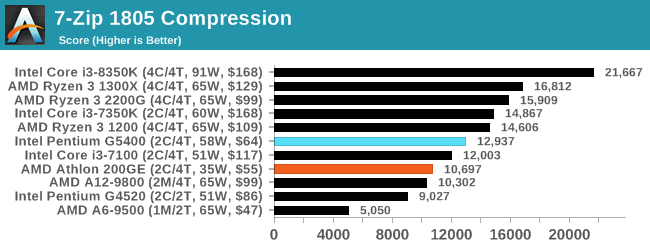
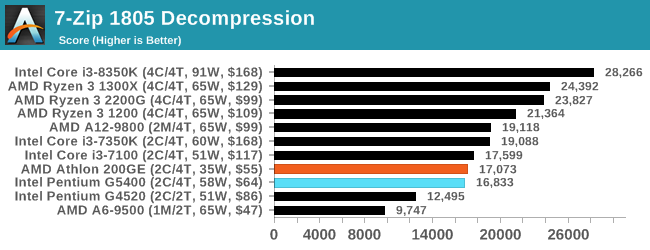
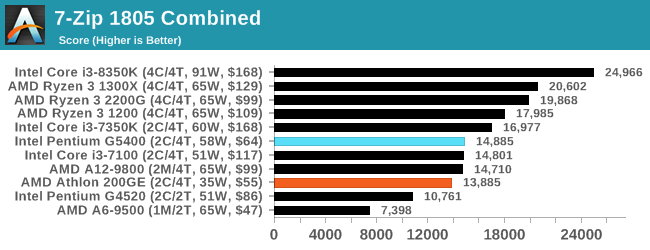
7-zip is an interesting test, given that Intel usually wins Compression but AMD wins Decompression. The same occurs here, however Intel wins the first test by a lot and AMD wins the second test by a small margin. Overall win to Intel here.
WinRAR 5.60b3: Archiving Tool
My compression tool of choice is often WinRAR, having been one of the first tools a number of my generation used over two decades ago. The interface has not changed much, although the integration with Windows right click commands is always a plus. It has no in-built test, so we run a compression over a set directory containing over thirty 60-second video files and 2000 small web-based files at a normal compression rate.
WinRAR is variable threaded but also susceptible to caching, so in our test we run it 10 times and take the average of the last five, leaving the test purely for raw CPU compute performance.
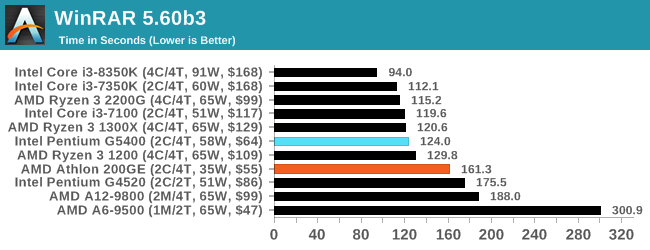
As a mixed workload that involves memory, this result would seem hard to predict given the two CPUs being tested. It ended up a clear win for Intel however – that extra core frequency in the G5400 mattered more than the main memory frequency of the 200GE.
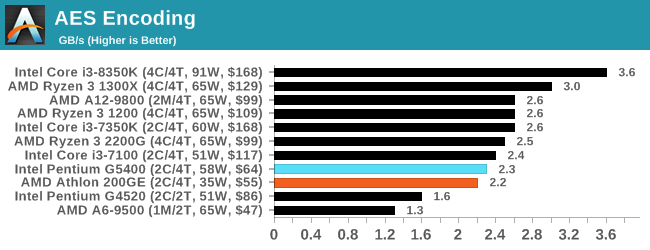
AES Encryption: File Security
A number of platforms, particularly mobile devices, are now offering encryption by default with file systems in order to protect the contents. Windows based devices have these options as well, often applied by BitLocker or third-party software. In our AES encryption test, we used the discontinued TrueCrypt for its built-in benchmark, which tests several encryption algorithms directly in memory.
The data we take for this test is the combined AES encrypt/decrypt performance, measured in gigabytes per second. The software does use AES commands for processors that offer hardware selection, however not AVX-512.


95 Comments
View All Comments
kkilobyte - Monday, January 14, 2019 - link
s/i3/Pentium. Obviously :)freedom4556 - Monday, January 14, 2019 - link
I think you messed up your charts for Civ 6's IGP testing. That or why are you testing the IGP at 1080p Ultra when all the other IGP tests are at 720p Low?freedom4556 - Monday, January 14, 2019 - link
Also, the 8k and 16k tests are pointless wastes of time. Especially in this review, but also in the others. Your low/med/high/ultra should be 720p/1080p/1440p/4k if you want to actually represent the displays people are purchasing.nevcairiel - Monday, January 14, 2019 - link
The Civ6 tests are like that because thats when it really starts to scale like the other games. Look at its IGP vs Low, which is 1080p vs 4K. The values are almost identical (and still pretty solid). Only if you move to 8K and then 16K you see the usual performance degredation you would see with other games.AnnoyedGrunt - Tuesday, January 15, 2019 - link
I second this motion. Please have settings to cover the various common monitor choices. 1080P is an obvious choice, but 1440P should be there too, along with 4K. I don't think you need to run two 4K versions, or two 1080P versions, or whatever. I have a 1440P monitor so it would be nice to see where I become GPU limited as opposed to CPU limited. Maybe Civ6 could use some extra high resolutions in the name of science, but to be useful, you should at least include the 1440P on all games.Thanks.
-AG
eddieobscurant - Monday, January 14, 2019 - link
Another pro intel article from Ian, who hopes that someday intel will hire himPeachNCream - Monday, January 14, 2019 - link
The numbers in the chart speak for themselves. You don't have to acknowledge the conclusion text. It's only a recommendation anyway. Even though I'd personally purchase a 200GE if I were in the market, I don't think there is any sort of individual bias coming into play. Where the 200GE is relevant, gaming on the IGP, Ian recommended it. In other cases the G5400 did come out ahead by enough of a margin to make it worth consideration. The only flaw I could tease out of this is the fact that the recommendation is based on MSRP and as others have noted, the G5400 is significantly above MSRP right now. It may have been good to acknowledge that in the intro and conclusion in a stronger manner, but that means the article may not stand up as well to the test of time for someone browsing this content six months later after searching for advice on the relevant CPUs via Google.kkilobyte - Monday, January 14, 2019 - link
Acknowledge "in a stronger manner"? Well, it is actually not acknowledged in the conclusion at all!The title of the article is: "The $60 CPU question". One of those CPU is clearly not being sold at $60 on average, but is priced significantly higher. I think the article should have compared CPUs that are really available at (around) $60.
So maybe there is no personal bias - but there is clearly ignorance of the market state. And that's surprizing, since the G5400 price was above its MSRP for several months already; how could a professional journalist in the field ignore that?
I guess it could be objected that "MSRP always was used in the past as the reference price". Granted - but it made sense while the MSRP was close to the real market price. It doesn't anymore once the gap gets big, which is the case for tbe G5400. Nobody gives a damn about the theorical price if it is applied nowhere on the market.
And the 'numbers of chart' don't 'speak for themselves' - they are basically comparing CPUs whose retail price, depending on where you get them, show a 20-40% price gap. What's the point? Why isn't there a price/performance graph, as there were in past reviews? The graphs could just as well include high-end CPUs, and would be just as useless.
If I want to invest ~$60 in a CPU, I'm not interested to know how a ~$90 one performs!
sonny73n - Tuesday, January 15, 2019 - link
+1I couldn’t have said it better myself.
cheshirster - Wednesday, January 23, 2019 - link
Yes, 5400 is priced nowhere near 60$ and reviewer definitely knows it, but fails to mention this in conclusion.