The $60 CPU Question: AMD Athlon 200GE or Intel Pentium Gold G5400? A Review
by Ian Cutress on January 14, 2019 8:00 AM ESTCPU Performance: Office Tests
The Office test suite is designed to focus around more industry standard tests that focus on office workflows, system meetings, some synthetics, but we also bundle compiler performance in with this section. For users that have to evaluate hardware in general, these are usually the benchmarks that most consider.
All of our benchmark results can also be found in our benchmark engine, Bench.
PCMark 10: Industry Standard System Profiler
Futuremark, now known as UL, has developed benchmarks that have become industry standards for around two decades. The latest complete system test suite is PCMark 10, upgrading over PCMark 8 with updated tests and more OpenCL invested into use cases such as video streaming.
PCMark splits its scores into about 14 different areas, including application startup, web, spreadsheets, photo editing, rendering, video conferencing, and physics. We post all of these numbers in our benchmark database, Bench, however the key metric for the review is the overall score.
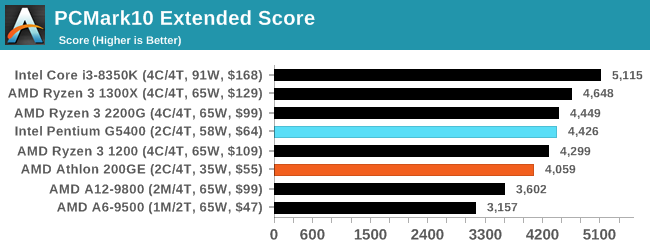
As an all-around test, one hopes that PCMark should be able to shine a light into this analysis. The end result is that PCMark says Intel should be ahead by around 8%.
Chromium Compile: Windows VC++ Compile of Chrome 56
A large number of AnandTech readers are software engineers, looking at how the hardware they use performs. While compiling a Linux kernel is ‘standard’ for the reviewers who often compile, our test is a little more varied – we are using the windows instructions to compile Chrome, specifically a Chrome 56 build from March 2017, as that was when we built the test. Google quite handily gives instructions on how to compile with Windows, along with a 400k file download for the repo.
In our test, using Google’s instructions, we use the MSVC compiler and ninja developer tools to manage the compile. As you may expect, the benchmark is variably threaded, with a mix of DRAM requirements that benefit from faster caches. Data procured in our test is the time taken for the compile, which we convert into compiles per day.
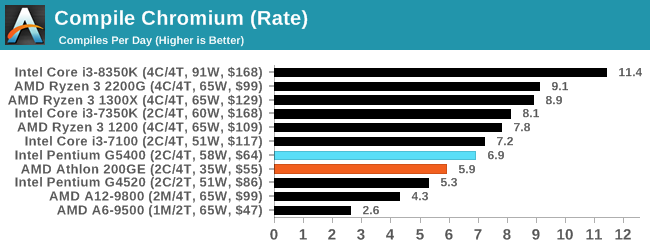
I like this Chromium test, given that it probes a lot of areas within a system. The Intel G5400 wins here again, scoring 6.9 compiles per day, compared to 5.9 for the AMD 200GE.
3DMark Physics: In-Game Physics Compute
Alongside PCMark is 3DMark, Futuremark’s (UL’s) gaming test suite. Each gaming tests consists of one or two GPU heavy scenes, along with a physics test that is indicative of when the test was written and the platform it is aimed at. The main overriding tests, in order of complexity, are Ice Storm, Cloud Gate, Sky Diver, Fire Strike, and Time Spy.
Some of the subtests offer variants, such as Ice Storm Unlimited, which is aimed at mobile platforms with an off-screen rendering, or Fire Strike Ultra which is aimed at high-end 4K systems with lots of the added features turned on. Time Spy also currently has an AVX-512 mode (which we may be using in the future).
For our tests, we report in Bench the results from every physics test, but for the sake of the review we keep it to the most demanding of each scene: Cloud Gate, Sky Diver, Fire Strike Ultra, and Time Spy.
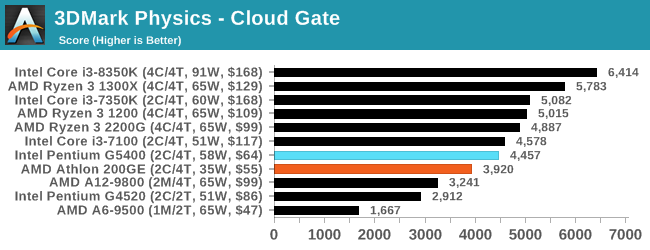
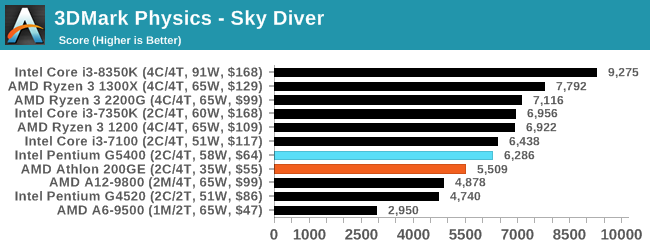
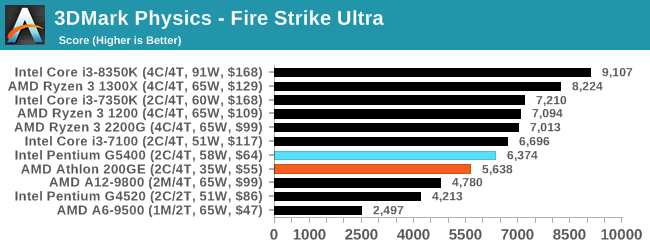
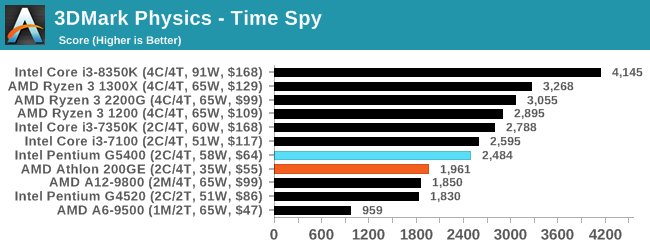
In all the tests except Time Spy, Intel takes an 11-12% lead over AMD, while in Time Spy that increases to 20%.
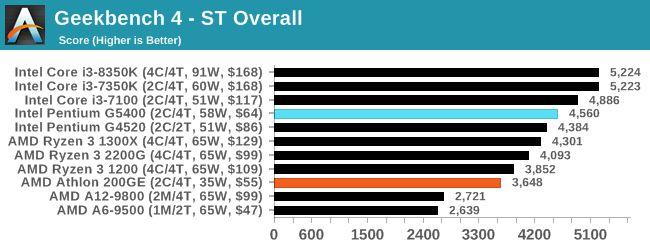
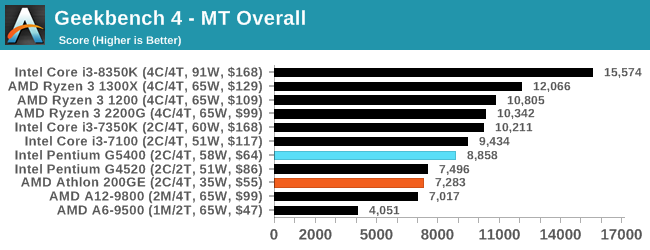
GeekBench4: Synthetics
A common tool for cross-platform testing between mobile, PC, and Mac, GeekBench 4 is an ultimate exercise in synthetic testing across a range of algorithms looking for peak throughput. Tests include encryption, compression, fast Fourier transform, memory operations, n-body physics, matrix operations, histogram manipulation, and HTML parsing.
I’m including this test due to popular demand, although the results do come across as overly synthetic, and a lot of users often put a lot of weight behind the test due to the fact that it is compiled across different platforms (although with different compilers).
We record the main subtest scores (Crypto, Integer, Floating Point, Memory) in our benchmark database, but for the review we post the overall single and multi-threaded results.


95 Comments
View All Comments
brakdoo - Monday, January 14, 2019 - link
The reason why I bought the 200GE last month: The 5400 is 75€+ and was above 80 when I bought my parts in my country. The Intel shortage makes it easy to decide but I that it'll be over soon.BTW: Does graphics performance have an influence on WebGL stuff like google maps or isn't that challenging enough?
blu42 - Monday, January 14, 2019 - link
Shouldn't 'measured under heavy load' suggest a heavy load for the entire package, not the CPU cores alone?Robotire - Monday, January 14, 2019 - link
This. I’m surprised a pure CPU (I think?) load was used. I would be interesting to know power usage while gaming.Also I’m more likely to buy a component that uses less power… but I guess some SUV owners might prefer it the other way.
Otherwise it’s a very interesting article, thanks! I don’t care at all about overpriced products, but reviews like this one are useful.
SaturnusDK - Monday, January 14, 2019 - link
It's important to note that even if you could get a G5400 at the $64 MSRP, it would be 16% more expensive than the $55 Athlon. However, you can't get the G5400 for $64. The lowest price I have ever seen it retail at is $80 which makes the choice for a absolutely bottom bin bargain buyer easy.If you're still even contemplating the G5400 at it's actual $80 price tag then it would be wise to consider if you can go the extra $20 and get the vastly superior 2200G instead.
Drumsticks - Monday, January 14, 2019 - link
As of right now, the Pentium G5400 is $129.99 on Newegg (??????) and $101 on Amazon from an alternate seller. OTOH, the Athlon 200GE is readily available from both for $60. That's a pretty stark difference.ikjadoon - Monday, January 14, 2019 - link
The pricing is out of whack at Newegg: G5400 for $129, G5500 (3.8GHz w/ UHD630) for $114, and G5600 (3.9GHz w/ UDH630) for $113.You save $16...while buying a higher-end part.
B&H Photo has it for slightly-less absurd 24% markup over MSRP ($80): https://www.bhphotovideo.com/c/product/1393125-REG...
khanikun - Tuesday, January 15, 2019 - link
Ya, the G5400 makes no sense with it's pricing. An i3 8100 is a quad core 3.6 ghz proc with UHD630 for $119. Unless power usage is a main concern, I wouldn't bother with any of those G procs currently. Until prices drops, doesn't make much sense to buy them.Zim - Saturday, January 19, 2019 - link
$65 at Fry's https://www.frys.com/product/9499961StevoLincolnite - Tuesday, January 15, 2019 - link
Even in Australia... The G5400 is $129. - Doesn't make sense to grab that when you can get the Ryzen 3 2200G for $155... You could probably find a motherboard that reduces that $26 pricing gap.Otherwise the 200GE is $79... $50 cheaper.
The G4920 is more inline with the 200GE's price at $89 currently... And at that point, the 200GE is still the decided victor.
PVG - Monday, January 14, 2019 - link
I think TDP has to cover simultaneous heavy usage of both the CPU and IGP. POV-Ray only really stresses the CPU side.I see how one can disregard the IGP contribution on higher end chips, but on models like this, where there's a big chance the IGP will actually be put to use, I fell it should be taken into account, on the power measuring front.