The Intel Core i9-9980XE CPU Review: Refresh Until it Hertz
by Ian Cutress on November 13, 2018 9:00 AM ESTHEDT Performance: System Tests
Our System Test section focuses significantly on real-world testing, user experience, with a slight nod to throughput. In this section we cover application loading time, image processing, simple scientific physics, emulation, neural simulation, optimized compute, and 3D model development, with a combination of readily available and custom software. For some of these tests, the bigger suites such as PCMark do cover them (we publish those values in our office section), although multiple perspectives is always beneficial. In all our tests we will explain in-depth what is being tested, and how we are testing.
All of our benchmark results can also be found in our benchmark engine, Bench.
Application Load: GIMP 2.10.4
One of the most important aspects about user experience and workflow is how fast does a system respond. A good test of this is to see how long it takes for an application to load. Most applications these days, when on an SSD, load fairly instantly, however some office tools require asset pre-loading before being available. Most operating systems employ caching as well, so when certain software is loaded repeatedly (web browser, office tools), then can be initialized much quicker.
In our last suite, we tested how long it took to load a large PDF in Adobe Acrobat. Unfortunately this test was a nightmare to program for, and didn’t transfer over to Win10 RS3 easily. In the meantime we discovered an application that can automate this test, and we put it up against GIMP, a popular free open-source online photo editing tool, and the major alternative to Adobe Photoshop. We set it to load a large 50MB design template, and perform the load 10 times with 10 seconds in-between each. Due to caching, the first 3-5 results are often slower than the rest, and time to cache can be inconsistent, we take the average of the last five results to show CPU processing on cached loading.
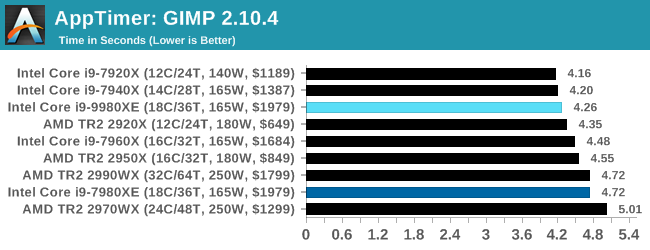
Loading software is usually an achilles heel of multi-core processors based on the lower frequency. The 9980XE pushes above and beyond the 7980XE in this regard, given it has better turbo performance across the board.
FCAT: Image Processing
The FCAT software was developed to help detect microstuttering, dropped frames, and run frames in graphics benchmarks when two accelerators were paired together to render a scene. Due to game engines and graphics drivers, not all GPU combinations performed ideally, which led to this software fixing colors to each rendered frame and dynamic raw recording of the data using a video capture device.
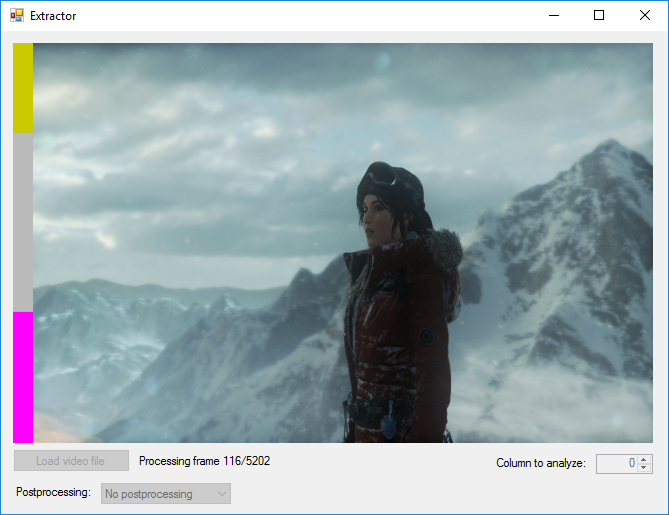
The FCAT software takes that recorded video, which in our case is 90 seconds of a 1440p run of Rise of the Tomb Raider, and processes that color data into frame time data so the system can plot an ‘observed’ frame rate, and correlate that to the power consumption of the accelerators. This test, by virtue of how quickly it was put together, is single threaded. We run the process and report the time to completion.
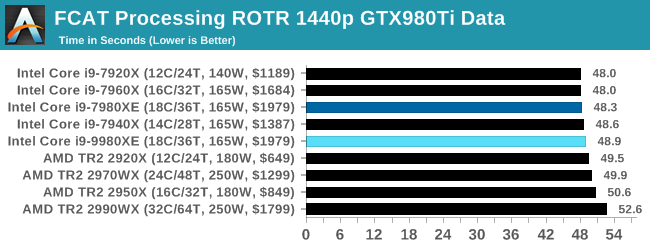
Despite the 9980XE having a higher frequency than the 7980XE, they both fall in the same region as all these HEDT processors seems to be trending towards 48 seconds. For context, the 5.0 GHz Core i9-9900K scores 44.7 seconds, another 8% or so faster.
3D Particle Movement v2.1: Brownian Motion
Our 3DPM test is a custom built benchmark designed to simulate six different particle movement algorithms of points in a 3D space. The algorithms were developed as part of my PhD., and while ultimately perform best on a GPU, provide a good idea on how instruction streams are interpreted by different microarchitectures.
A key part of the algorithms is the random number generation – we use relatively fast generation which ends up implementing dependency chains in the code. The upgrade over the naïve first version of this code solved for false sharing in the caches, a major bottleneck. We are also looking at AVX2 and AVX512 versions of this benchmark for future reviews.
For this test, we run a stock particle set over the six algorithms for 20 seconds apiece, with 10 second pauses, and report the total rate of particle movement, in millions of operations (movements) per second. We have a non-AVX version and an AVX version, with the latter implementing AVX512 and AVX2 where possible.
3DPM v2.1 can be downloaded from our server: 3DPMv2.1.rar (13.0 MB)
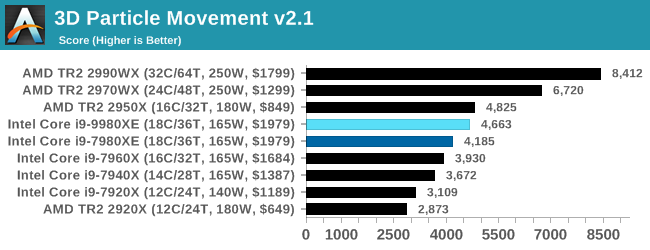
Without any AVX code, our 3DPM test shows that with fewer cores, AMD's 16-core Threadripper actually beats both of the 7980XE and 9980XE. The higher core count AMD parts blitz the field.
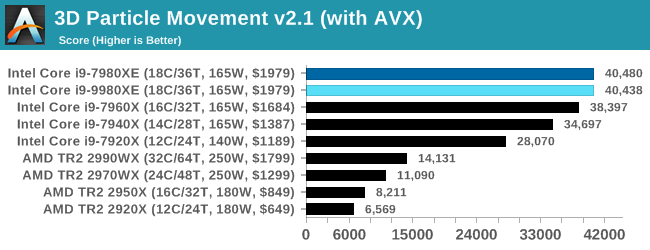
When we add AVX2 / AVX512, the Intel HEDT systems go above and beyond. This is the benefit of hand-tuned AVX512 code. Interestingly the 9980XE scores about the same as the 7980XE - I have a feeling that the AVX512 turbo tables for both chips are identical.
Dolphin 5.0: Console Emulation
One of the popular requested tests in our suite is to do with console emulation. Being able to pick up a game from an older system and run it as expected depends on the overhead of the emulator: it takes a significantly more powerful x86 system to be able to accurately emulate an older non-x86 console, especially if code for that console was made to abuse certain physical bugs in the hardware.
For our test, we use the popular Dolphin emulation software, and run a compute project through it to determine how close to a standard console system our processors can emulate. In this test, a Nintendo Wii would take around 1050 seconds.
The latest version of Dolphin can be downloaded from https://dolphin-emu.org/
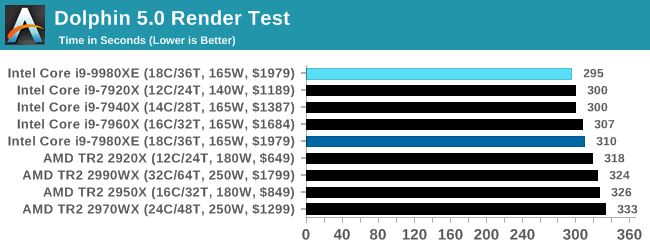
Dolphin enjoys single thread frequency, so at 4.5 GHz we see the 9980XE getting a small bump over the 7980XE.
DigiCortex 1.20: Sea Slug Brain Simulation
This benchmark was originally designed for simulation and visualization of neuron and synapse activity, as is commonly found in the brain. The software comes with a variety of benchmark modes, and we take the small benchmark which runs a 32k neuron / 1.8B synapse simulation, equivalent to a Sea Slug.

Example of a 2.1B neuron simulation
We report the results as the ability to simulate the data as a fraction of real-time, so anything above a ‘one’ is suitable for real-time work. Out of the two modes, a ‘non-firing’ mode which is DRAM heavy and a ‘firing’ mode which has CPU work, we choose the latter. Despite this, the benchmark is still affected by DRAM speed a fair amount.
DigiCortex can be downloaded from http://www.digicortex.net/
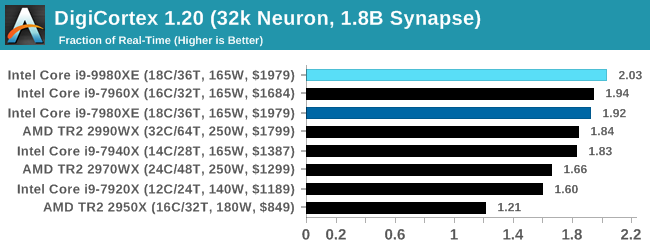
DigiCortex requires a good memory subsystem as well as cores and frequency. We get a small bump for the new 9980XE here.
y-Cruncher v0.7.6: Microarchitecture Optimized Compute
I’ve known about y-Cruncher for a while, as a tool to help compute various mathematical constants, but it wasn’t until I began talking with its developer, Alex Yee, a researcher from NWU and now software optimization developer, that I realized that he has optimized the software like crazy to get the best performance. Naturally, any simulation that can take 20+ days can benefit from a 1% performance increase! Alex started y-cruncher as a high-school project, but it is now at a state where Alex is keeping it up to date to take advantage of the latest instruction sets before they are even made available in hardware.
For our test we run y-cruncher v0.7.6 through all the different optimized variants of the binary, single threaded and multi-threaded, including the AVX-512 optimized binaries. The test is to calculate 250m digits of Pi, and we use the single threaded and multi-threaded versions of this test.
Users can download y-cruncher from Alex’s website: http://www.numberworld.org/y-cruncher/
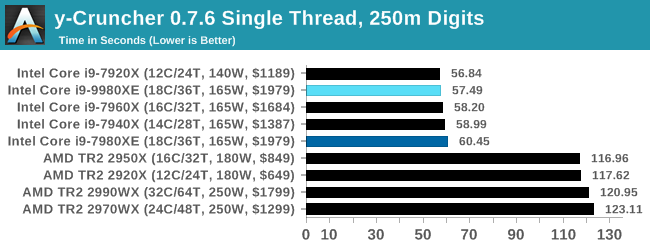
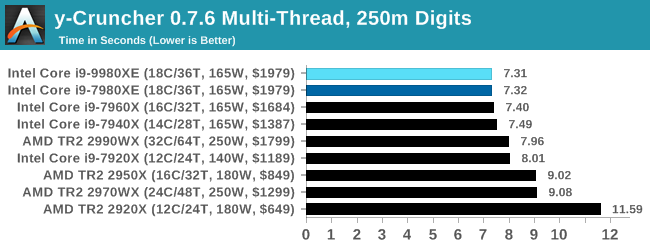
With another one of our AVX2/AVX512 tests, the Skylake-X parts win in both single thread and multi-threads.
Agisoft Photoscan 1.3.3: 2D Image to 3D Model Conversion
One of the ISVs that we have worked with for a number of years is Agisoft, who develop software called PhotoScan that transforms a number of 2D images into a 3D model. This is an important tool in model development and archiving, and relies on a number of single threaded and multi-threaded algorithms to go from one side of the computation to the other.
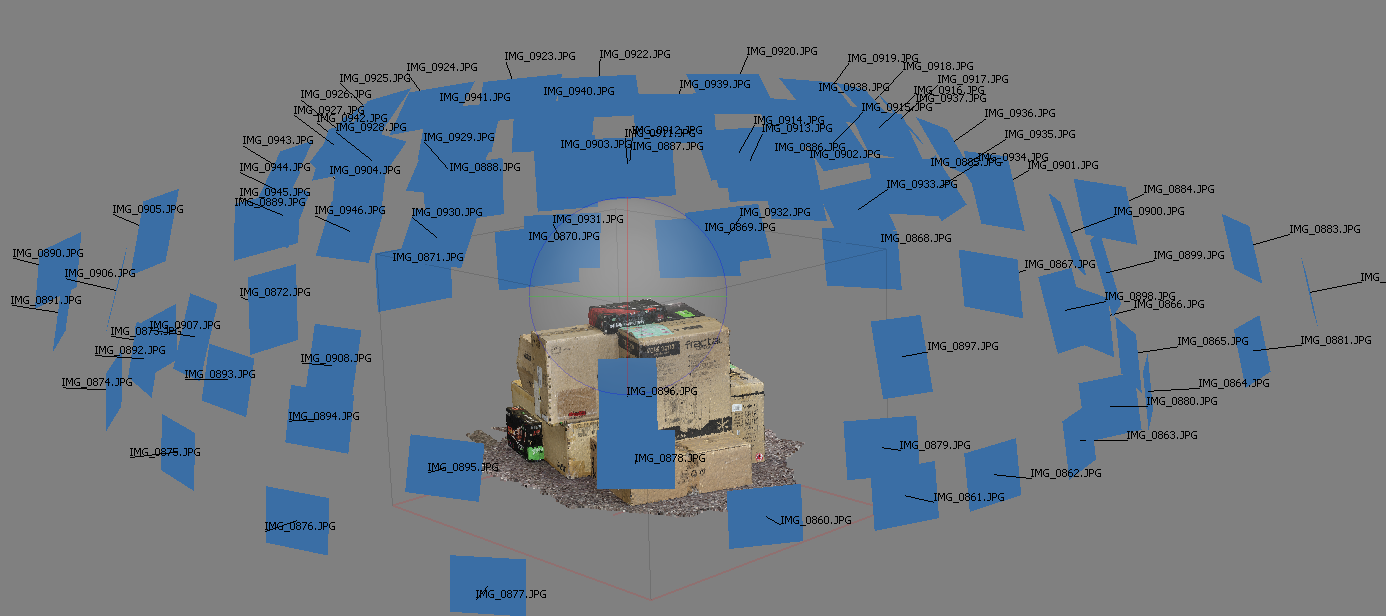
In our test, we take v1.3.3 of the software with a good sized data set of 84 x 18 megapixel photos and push it through a reasonably fast variant of the algorithms, but is still more stringent than our 2017 test. We report the total time to complete the process.
Agisoft’s Photoscan website can be found here: http://www.agisoft.com/
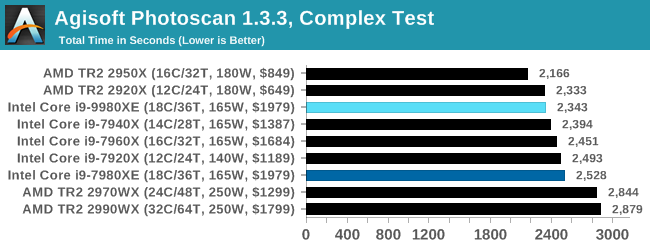
Photoscan is a mix of parallel compute and single threaded work, and the 9980XE does give another 7-8% performance over the 7980XE. The AMD dual-die TR2 parts still have the edge, however.


143 Comments
View All Comments
TheJian - Friday, November 16, 2018 - link
I stopped reading when I saw 8k with a 1080. Most tests are just pointless, as it would be more interesting with a 1080ti at least or better 2080ti. That would give the chips more room to run when they can to separate the men from the boys so to speak.Vid tests with handbrake stupid too. Does anyone look at the vid after those tests? It would look like crap. Try SLOWER as a setting and lets find out how the chips fare, and bitrates of ~4500-5000 for 1080p. Something I'd actually watch on a 60in+ tv without going blind.
Release groups for AMZN for example release 5000 bitrate L4.1, 5-9 ref frames, SLOWER. etc. Nfo files reveal stuff like this:
cabac=1 / ref=9 / deblock=1:-3:-3 / analyse=0x3:0x133 / me=umh / subme=11 / psy=1 / psy_rd=1.00:0.00 / mixed_ref=1 / me_range=32 / chroma_me=1 / trellis=2 / 8x8dct=1 / cqm=0 / deadzone=21,11 / fast_pskip=0 / chroma_qp_offset=-2 / threads=6 / lookahead_threads=1 / sliced_threads=0 / nr=0 / decimate=0 / interlaced=0 / bluray_compat=0 / constrained_intra=0 / bframes=8 / b_pyramid=2 / b_adapt=2 / b_bias=0 / direct=3 / weightb=1 / open_gop=0 / weightp=2 / keyint=250 / keyint_min=23 / scenecut=40 / intra_refresh=0 / rc=crf / mbtree=0 / crf=17.0 / qcomp=0.60 / qpmin=0 / qpmax=69 / qpstep=4 / ip_ratio=1.40 / pb_ratio=1.30 / aq=3:0.85
More than I'd do, but the point is, SLOWER will give you far better quality (something I could actually stomach watching), without all the black blocks in dark scenes etc. Current 720p releases from nf or amzn have went to crap (700mb files for h264? ROFL). We are talking untouched direct from NF or AMZN. Meaning that is the quality you are watching as a subscriber that is, which is just one of the reasons we cancelled NF (agenda TV was the largest reason to dump them).
If you're going to test at crap settings nobody would watch, might as well kick in quicksync with quality maxed and get better results as MOST people would do if quality wasn't an issue anyway.
option1=value1:option2=value2:tu=1:ref=9:trellis=3 and L4.1 with encoder preset set to QUALITY.
That's a pretty good string for decent quality with QSV. Seems to me you're choosing to turn off AVX/Quicksync so AMD looks better or something. Why would any USER turn off stuff that speeds things up unless quality (guys like me) is an issue? Same with turning off gpu in blender etc. What is the point of a test that NOBODY would do in real life? Who turns off AVX512 in handbrake if you bought a chip to get it? LOL. That tech is a feature you BUY intel for. IF you turn off all the good stuff, the chip becomes a ripoff. But users don't do that :) Same for NV, if you have the ability to use RTX stuff, why would you NOT when a game supports it? To make AMD cards look better? Pffft. To wait for AMD to catch up? Pffft.
I say this as an AMD stock holder :) Most useless review I've seen in a while. Not wasting my time reading much of it. Moving on to better reviews that actually test how we PLAY/WATCH/WORK in the real world. 8K...ROFLMAO. Ryan has been claiming 1440p was norm since 660ti. Then it was 4k not long after for the last 5yrs when nobody was using that, now it's 8k tests with a GTX 1080...ROFLMAO. No wonder I come here once a month or less pretty much and when I do, I'm usually turned off by the tests. Constantly changing what people do (REAL TESTS) to turning stuff off, down, (vid cards at ref speeds instead of OC OOTB settings etc), etc etc...Let's see if we can set up this test in a way nobody would do at home to strike down advantages of anyone competing with AMD. Blah. I'd rather see where both sides REALLY win in ways we USE these products. Turn everything on if it's in the chip, gpu, test, etc and spend MORE time testing resolutions etc we actually USE in practice. 8k...hahaha. Whatever. 13fps?
"Ashes has dropdown options for MSAA, Light Quality, Object Quality, Shading Samples, Shadow Quality, Textures, and separate options for the terrain."
Yeah, I'm out. Dropdown quality is against my religion and useless to me. I'm sure the other tests have issues I'd hate also, no time to waste on junk review tests. Too many other places that don't do this crap. I bought a 1070ti to run MAX settings at 1200p (dell 24in) in everything or throw it to my lower res 22in. If I can't do that, I'll wait for my next card to play game X. Not knocking AMD here, just Anandtech. I'll likely buy a 7nm AMD cpu when they hit, and they have a shot at a 7nm gpu for me too. You guys and tomshardware (heh, you joined) have really went downhill with irrational testing setups. If you're going to do 4k at ultra, why not do them all there? I digress...
spikespiegal - Saturday, November 24, 2018 - link
Just curious, but how many of you AMD fanbois have ever been in a data center or been responsible for adjusting performance on a couple dozen VMware hosts running mixed applications? Oh wait...none. In the mythical world according to AMDs BS dept a Hypervisor / Operating system takes the number of tasks running and divides them by the number of cores running, and you clowns believe it. In the *real world* where we have to deal with really expensive hosts that don't have LED fans in them and run applications adults use we know that's not the truth. Hypervisors and Operating systems schedulers all favor cores that process mixed threads faster, and if you want to argue that please consult with a VMware or Hyper-V engineer the next time you see them in your drive thru. Oh wait...I am a VMware engineer.An i3 8530 costs $200 and literally beats any AMD chip made running stock in dual threaded applications. Seriously....look up the single threaded performance. More cores don't make an application more multithreaded and they don't make contribute to a better desktop experience. I have servers with 30-40% of my CPU resources not being used, and just assigning more cores won't make applications faster. It just ties up my scheduler doing nothing and wastes performance. The only way to get better application efficiency is vertical, and that's higher core performance, and that's nothing I'm seeing AMD bringing to the table.
Michael011 - Wednesday, December 12, 2018 - link
The pricing shows just how greedy Intel has become. It is better to spend your money on a top end AMD Threadripper and motherboard. https://mobdro.io/