The Intel SSD 660p SSD Review: QLC NAND Arrives For Consumer SSDs
by Billy Tallis on August 7, 2018 11:00 AM ESTRandom Read Performance
Our first test of random read performance uses very short bursts of operations issued one at a time with no queuing. The drives are given enough idle time between bursts to yield an overall duty cycle of 20%, so thermal throttling is impossible. Each burst consists of a total of 32MB of 4kB random reads, from a 16GB span of the disk. The total data read is 1GB.
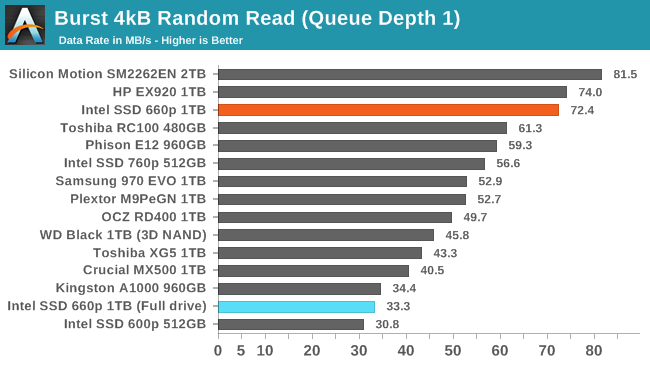
The Intel SSD 660p delivers excellent random read performance from its SLC cache, coming in behind only the drives using Silicon Motion's higher-end controllers with Intel/Micron TLC. When reading data from a full drive where background processing is probably still ocurring, the performance is halved but remains slightly ahead of the Intel 600p.
Our sustained random read performance is similar to the random read test from our 2015 test suite: queue depths from 1 to 32 are tested, and the average performance and power efficiency across QD1, QD2 and QD4 are reported as the primary scores. Each queue depth is tested for one minute or 32GB of data transferred, whichever is shorter. After each queue depth is tested, the drive is given up to one minute to cool off so that the higher queue depths are unlikely to be affected by accumulated heat build-up. The individual read operations are again 4kB, and cover a 64GB span of the drive.
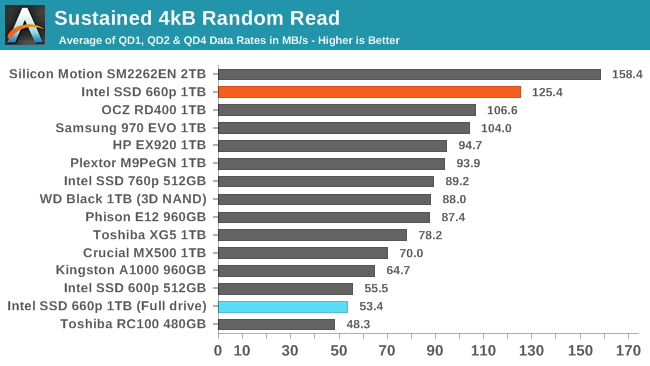
On the longer random read test, the 660p maintains its outstanding SLC cache performance that beats anything else currently on the market, but filling the drive it is slower than almost any other NVMe SSD - the exception being the Toshiba RC100 that doesn't use a large enough host memory buffer for the data range this test covers.
 |
|||||||||
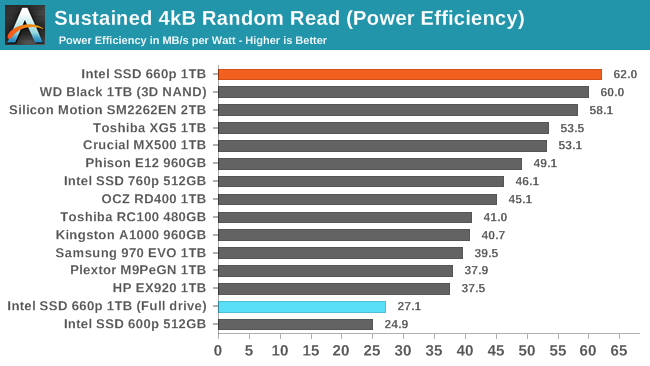
| Power Efficiency in MB/s/W | Average Power in W | ||||||||
With the combination of lower power consumption afforded by its small NVMe controller and excellent random read performance, the Intel 660p earns the top efficiency score for this test. When it's slowed down by being full and still grinding away at background cleanup, its efficiency is much worse but still an improvement over the 600p.
 |
|||||||||
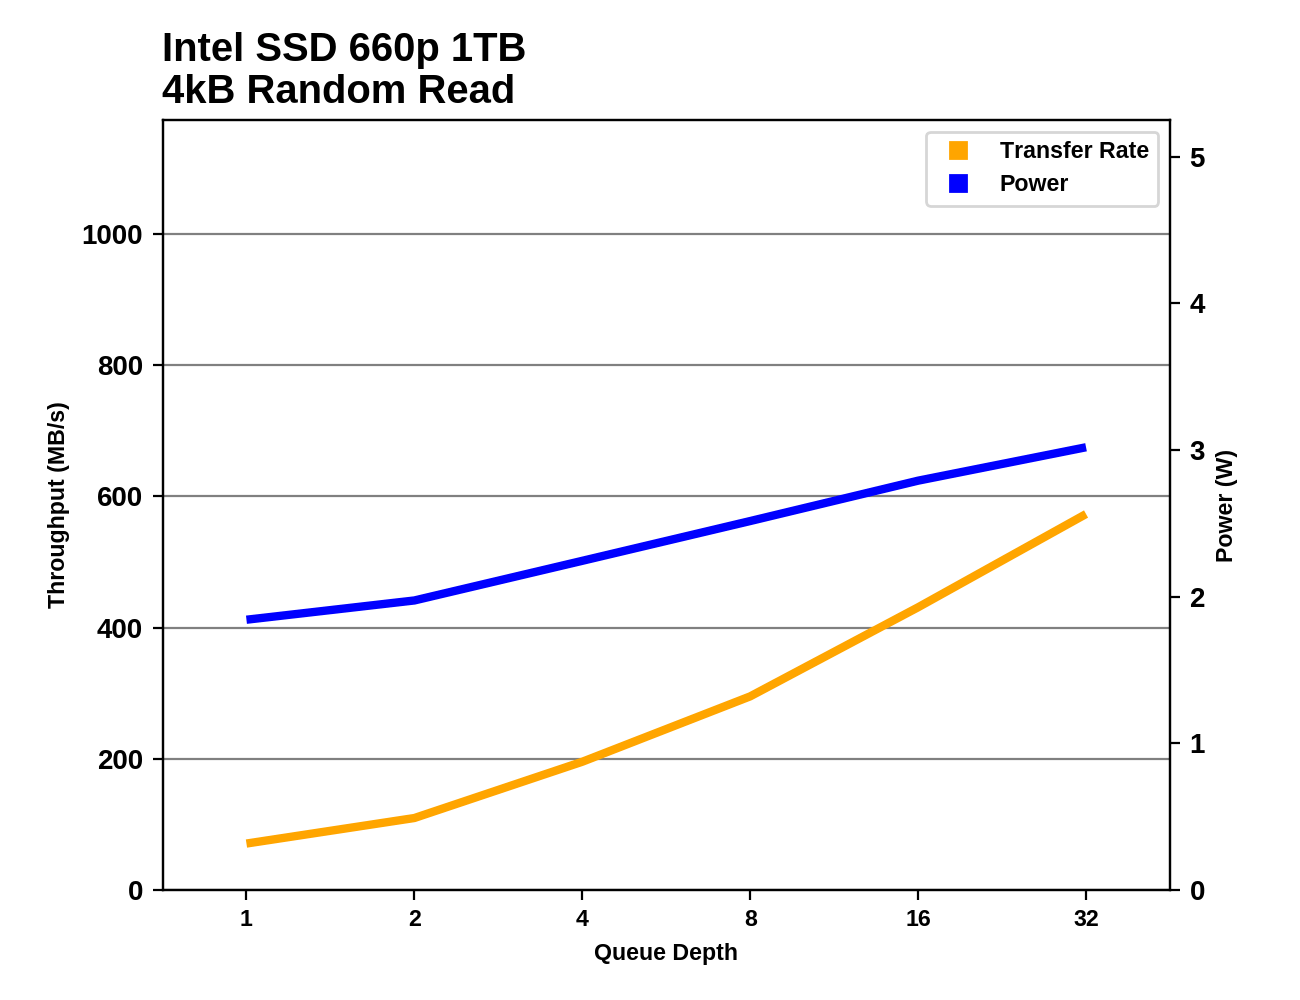
At high queue depths the 660p's random read speed begins to fall behind high-end NVMe SSDs, but it isn't significant until well beyond the queue depths that are relevant to real-world client/consumer usage patterns.
Random Write Performance
Our test of random write burst performance is structured similarly to the random read burst test, but each burst is only 4MB and the total test length is 128MB. The 4kB random write operations are distributed over a 16GB span of the drive, and the operations are issued one at a time with no queuing.
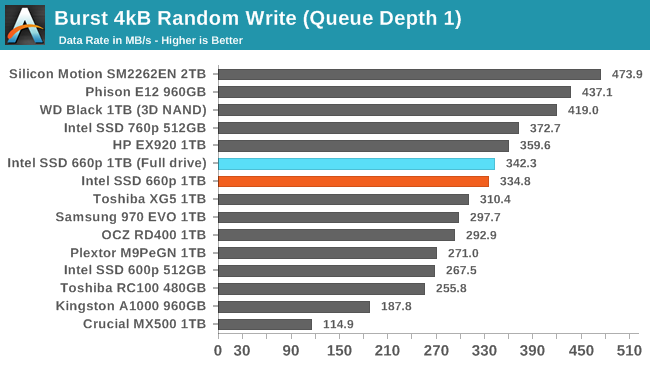
The burst random write speed of the Intel SSD 660p is not record-setting, but it is comparable to high-end NVMe SSDs.
As with the sustained random read test, our sustained 4kB random write test runs for up to one minute or 32GB per queue depth, covering a 64GB span of the drive and giving the drive up to 1 minute of idle time between queue depths to allow for write caches to be flushed and for the drive to cool down.
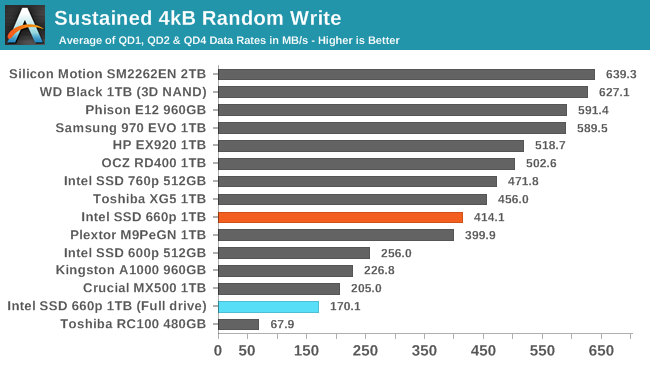
On the longer random write test, the 660p is slower than most high-end NVMe SSDs but still performs much better than the other entry-level NVMe drives or the SATA drive. After filling the drive (and consequently the SLC write cache), the performance drops below the SATA drive but is still more than twice as fast as the Toshiba RC100.
 |
|||||||||
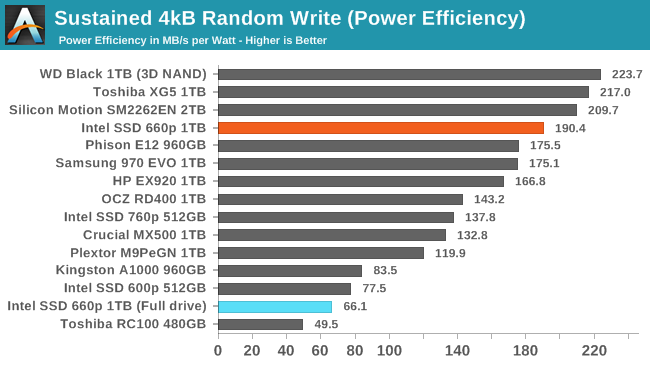
| Power Efficiency in MB/s/W | Average Power in W | ||||||||
Power efficiency when performing random writes to a clean SLC cache is not quite the best we've measured, but it is far ahead of what the other low-end NVMe SSD drives or the Crucial MX500 SATA drive can manage
 |
|||||||||
After QD4 the 660p starts to show signs of filling the SLC write cache, which is a little bit sooner than expected given how large the SLC cache should be for the mostly-empty drive condition. The performance doesn't drop very far, showing that the idle time is enough for the drive to mostly keep up with flushing the SLC cache when the test is writing to the drive with a 50% duty cycle.


86 Comments
View All Comments
woggs - Tuesday, August 7, 2018 - link
2D nand was abandoned because it squeezed the storage element down to a size where it became infeasible to scale further and still store data reliably. The move to 3D nand took back the needed size of the memory element to store more charge. Cost reduction from scaling is no longer reliant directly on the reduction of the storage element. This is a key enabler for TLC and QLC.woggs - Tuesday, August 7, 2018 - link
Stated another way... Scaling 2D flash cells proportionally reduced the stored charge available to divide up into multiple levels, making any number of bits per cell proportionally more difficult. The the question of cost reduction was which is faster and cheaper: scale the cell to smaller size or deliver more bits/cell? 2 bits per cell was achievable fast enough to justify it's use for cost reduction in parallel with process scaling, which was taking 18 to 24 months a pop. TLC was achievable on 2D nodes (not the final ones) but not before the next process node would be available. 3D has completely changed the scaling game and makes more bits per cell feasible, with less degradation in the ability to deliver as the process scales. The early 3D nodes "weren't very good" because they were the first 3D nodes going through the new learning curve.PeachNCream - Tuesday, August 7, 2018 - link
Interesting performance measurements. Variable size pseudo-SLC really helps to cover up the QLC performance penalties which look pretty scary when the drive is mostly full. The .1 DWPD rating is bad, but typical consumers aren't likely to thrash a drive with that many writes on a daily basis though Anandtech's weighty benchmarks ate up 1% of the total rated endurance in what is a comparable blink of an eye in the overall life of a storage device.In the end, I don't think there's a value proposition in owning such the 660p in specific if you're compelled to leave a substantial chunk of the drive in an empty state so the performance doesn't rapidly decline. In effect, the buyer is purchasing more capacity than required to retain performance so why not just purchase a TLC or MLC drive and suffer less performance loss and therefore gain more usable space?
Oxford Guy - Tuesday, August 7, 2018 - link
The 840's TLC degraded performance because of falling voltages, not because of anyone "thrashing" the drive.However, it is also true that the performance of the 120 GB drive was appalling in steady state.
mapesdhs - Wednesday, August 8, 2018 - link
Again, 840 EVO; few sites covered the standard 840, there's not much data. I think it does suffer from the same issue, but most media coverage was about the EVO version.Spunjji - Wednesday, August 8, 2018 - link
It does suffer from the same problem. It wasn't fixed. Not sure why Oxford *keeps* bringing it up in response to unrelated comments, though.Oxford Guy - Friday, August 10, 2018 - link
The point is that there is more to SSD reliability than endurance ratings.Oxford Guy - Friday, August 10, 2018 - link
"few sites covered the standard 840"The 840 got a lot of hype and sales.
FunBunny2 - Tuesday, August 7, 2018 - link
with regard to power-off retention: is a stat estimation from existing USB sticks (on whatever node) and such, meaningful? whether or not, what might be the prediction?milkywayer - Tuesday, August 7, 2018 - link
My question is, should I truest this drive with valuable info if endurance can be an issue?If the PC is frequently powered On, will it refresh the cells?