The Intel Optane Memory M10 (64GB) Review: Optane Caching Refreshed
by Billy Tallis on May 15, 2018 10:45 AM EST- Posted in
- SSDs
- Storage
- Intel
- PCIe SSD
- SSD Caching
- M.2
- NVMe
- Optane
- Optane Memory
Mixed Random Performance
Our test of mixed random reads and writes covers mixes varying from pure reads to pure writes at 10% increments. Each mix is tested for up to 1 minute or 32GB of data transferred. The test is conducted with a queue depth of 4, and is limited to a 64GB span of the drive. In between each mix, the drive is given idle time of up to one minute so that the overall duty cycle is 50%.
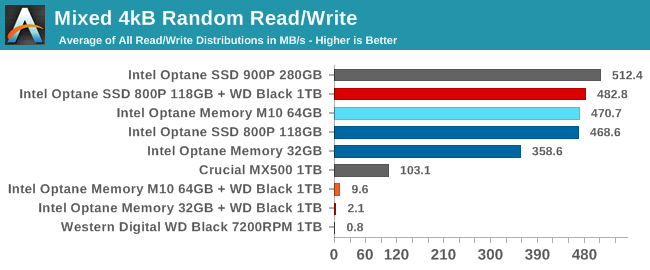
Unsurprisingly, the mixed random I/O test produces crap performance from the hard drive and the two cache configurations where the cache is too small for this test. The 118GB Optane SSD 800P is more cache than this test needs, and it performs almost as well as the Optane SSD 900P.
 |
|||||||||
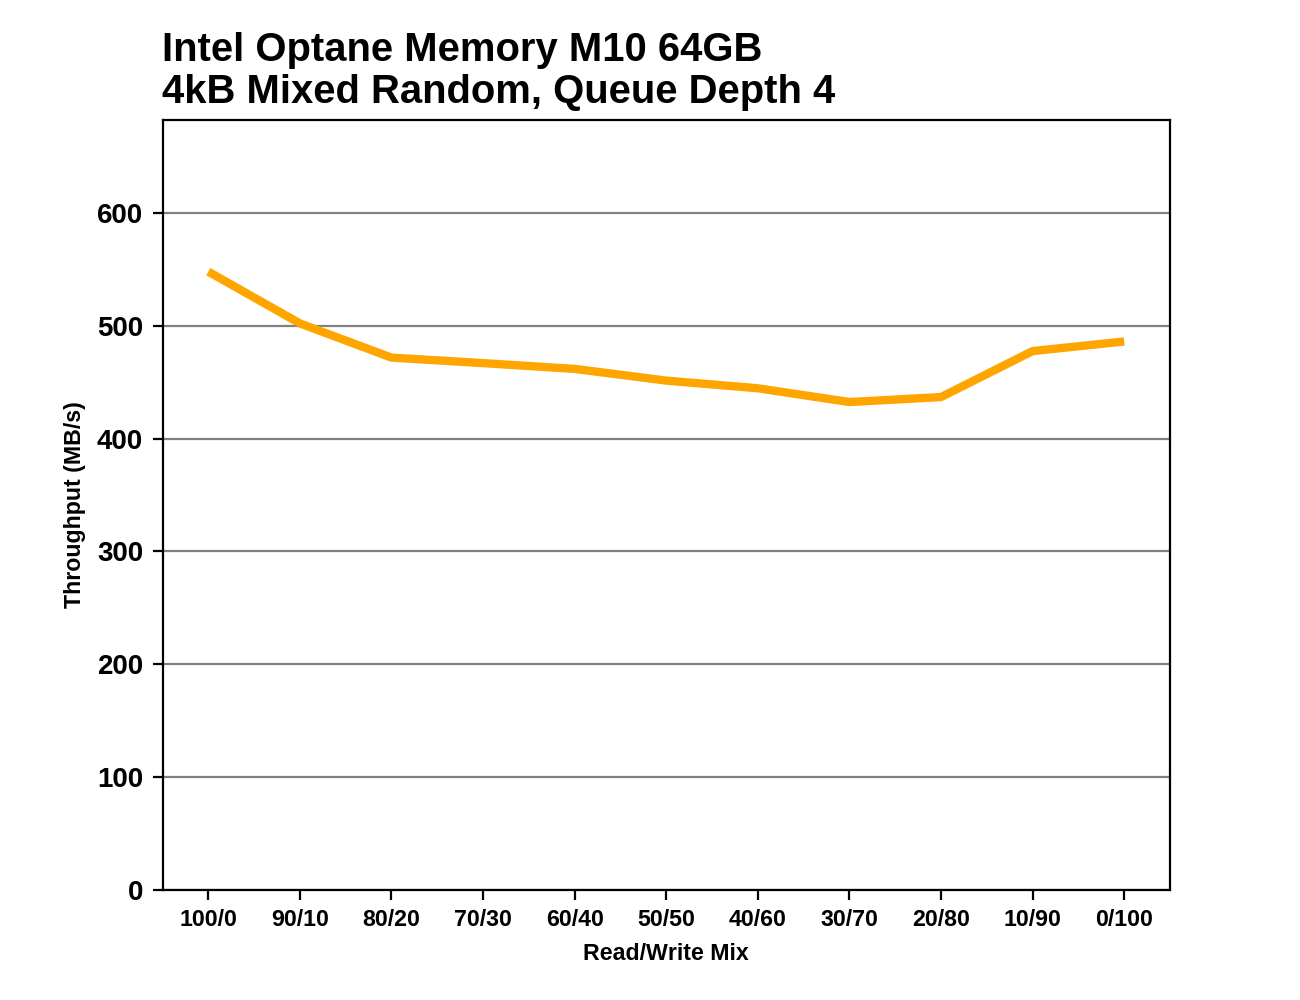
When used as a cache for this test, the largest Optane SSD 800P shows slightly different performance characteristics than when it is treated as a standalone drive, but in either case it is a strong performer across the board. The smaller Optane drives aren't large enough to cache the entire working set of this test and can't do much to improve performance over the hard drive.
Mixed Sequential Performance
Our test of mixed sequential reads and writes differs from the mixed random I/O test by performing 128kB sequential accesses rather than 4kB accesses at random locations, and the sequential test is conducted at queue depth 1. The range of mixes tested is the same, and the timing and limits on data transfers are also the same as above.
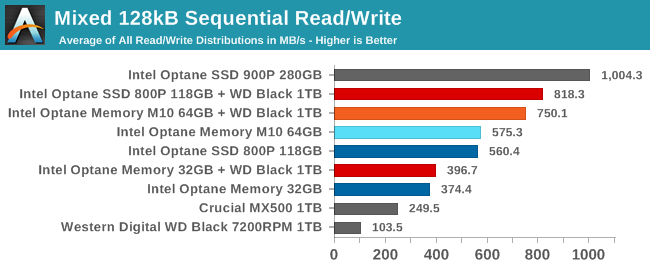
All of the Optane configurations easily outperform the SATA drives on the mixed sequential I/O test. The 64GB and 118GB modules are tied when tested as standalone drives and close when tested as cache devices, and the cache performance is 30-40% faster than the standalone SSD performance. The 32GB module is substantially slower and performance is much closer between caching and standalone SSD use.
 |
|||||||||
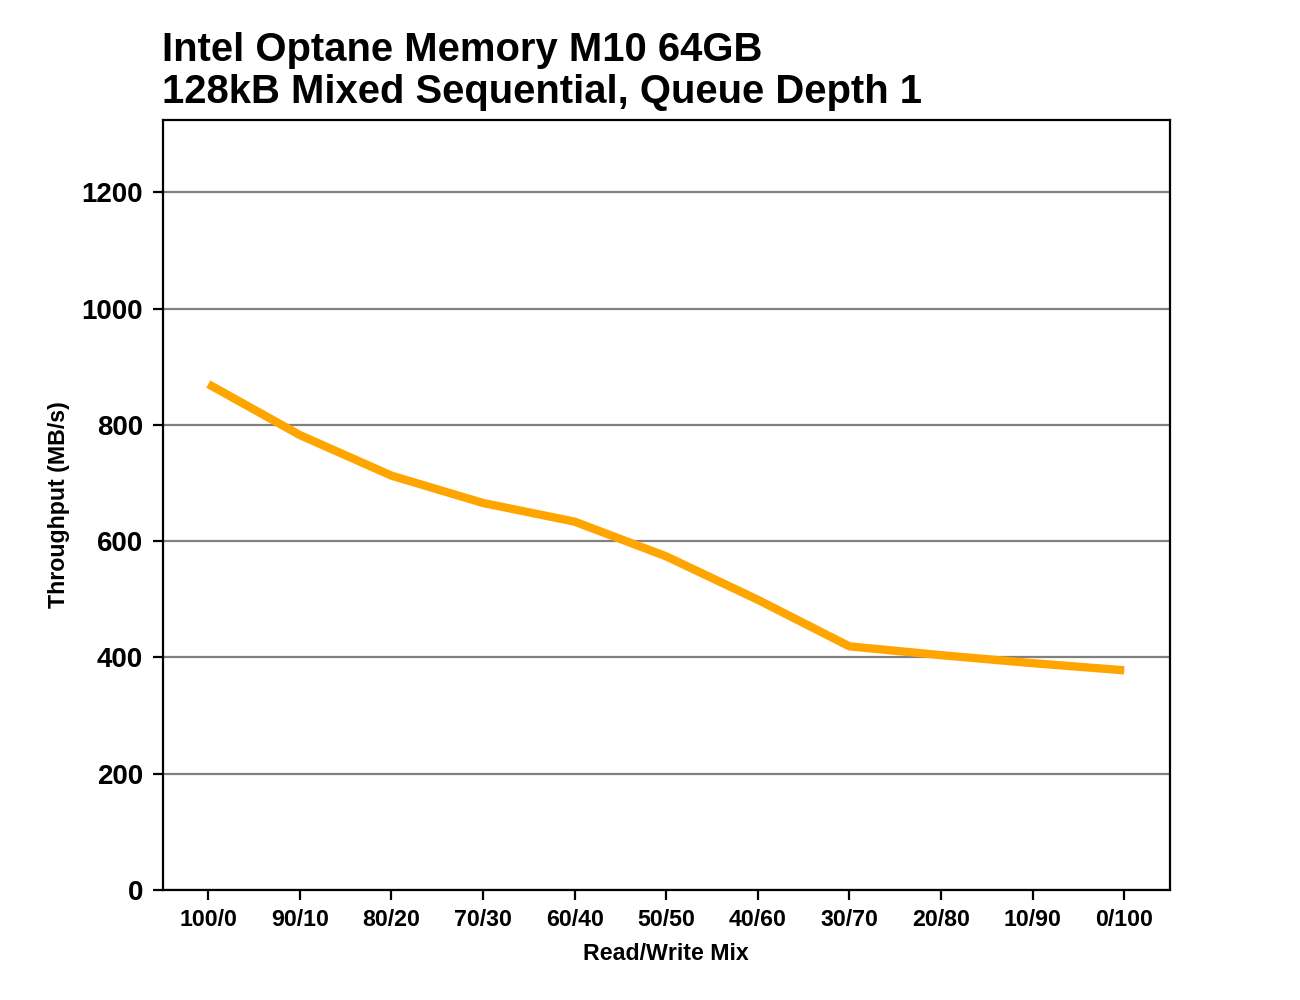
The performance improvements in the caching configurations over the standalone drive configurations generally apply throughout the mixed sequential test. The main exception is in the early phases of the test with the 32GB cache, where cache performance falls far short of the standalone drive performance. Once the proportion of reads has dropped to 70%, the cache configuration comes out ahead.


96 Comments
View All Comments
jordanclock - Wednesday, May 16, 2018 - link
Yeah, 64GB is ~59GiB.IntelUser2000 - Tuesday, May 15, 2018 - link
Billy,Could you tell us why the performance is much lower? I was thinking Meltdown but 800P article says it has the patch enabled. The random performance here is 160MB/s for 800P, but on the other article it gets 600MB/s.
Billy Tallis - Tuesday, May 15, 2018 - link
The synthetic benchmarks in this review were all run under Windows so that they could be directly compared to results from the Windows-only caching drivers. My other reviews use Linux for the synthetic benchmarks. At the moment I'm not sure if the big performance disparity is due entirely to Windows limitations, or if there's some system tuning I could do to Windows to bring performance back up. My Linux testbed is set up to minimize OS overhead, but the Windows images used for this reivew were all stock out of the box settings.IntelUser2000 - Tuesday, May 15, 2018 - link
What is used for the random tests? IOmeter?Billy Tallis - Tuesday, May 15, 2018 - link
FIO version 3.6, Windows binaries from https://bluestop.org/fio/ (and Linux binaries compiled locally, for the other reviews). The only fio settings that had to change when moving the scripts from Linux to Windows was the ioengine option for selecting which APIs to use for IO. On Linux, QD1 tests are done with synchronous IO and higher queue depths with libaio, and on Windows all the queue depths used asynchronous IO.In this review I also didn't bother secure erasing the drives between running the burst and sustained tests, but that shouldn't matter much for these drives.
IntelUser2000 - Tuesday, May 15, 2018 - link
So looking at the original Optane Memory review, the loss must be due to Meltdown as it also gets 400MB/s.Billy Tallis - Tuesday, May 15, 2018 - link
The Meltdown+Spectre workarounds don't have anywhere near this kind of impact on Linux, so I don't think that's a sufficient explanation for what's going on with this review's Windows results.Last year's Optane Memory review only did synthetic benchmarks of the drive as a standalone device, not in a caching configuration because the drivers only supported boot drive acceleration at that time.
IntelUser2000 - Tuesday, May 15, 2018 - link
The strange performance may also explain why its sometimes faster in caching than when its standalone.Certainly the drive is capable of faster than that looking at raw media performance.
My point with the last review was that, whether its standalone or not, the drive on the Optane Memory review is getting ~400MB/s, while in this review its getting 160MB/s.
tuxRoller - Wednesday, May 16, 2018 - link
As Billy said you're comparing the results from two different OSs'Intel999 - Tuesday, May 15, 2018 - link
Will there be a comparison between the uber expensive Intel approach to sped up boot times with AMD's free approach using StorageMI?