The AMD 2nd Gen Ryzen Deep Dive: The 2700X, 2700, 2600X, and 2600 Tested
by Ian Cutress on April 19, 2018 9:00 AM ESTShadow of Mordor
The next title in our testing is a battle of system performance with the open world action-adventure title, Middle Earth: Shadow of Mordor (SoM for short). Produced by Monolith and using the LithTech Jupiter EX engine and numerous detail add-ons, SoM goes for detail and complexity. The main story itself was written by the same writer as Red Dead Redemption, and it received Zero Punctuation’s Game of The Year in 2014.
A 2014 game is fairly old to be testing now, however SoM has a stable code and player base, and can still stress a PC down to the ones and zeroes. At the time, SoM was unique, offering a dynamic screen resolution setting allowing users to render at high resolutions that are then scaled down to the monitor. This form of natural oversampling was designed to let the user experience a truer vision of what the developers wanted, assuming you had the graphics hardware to power it but had a sub-4K monitor.
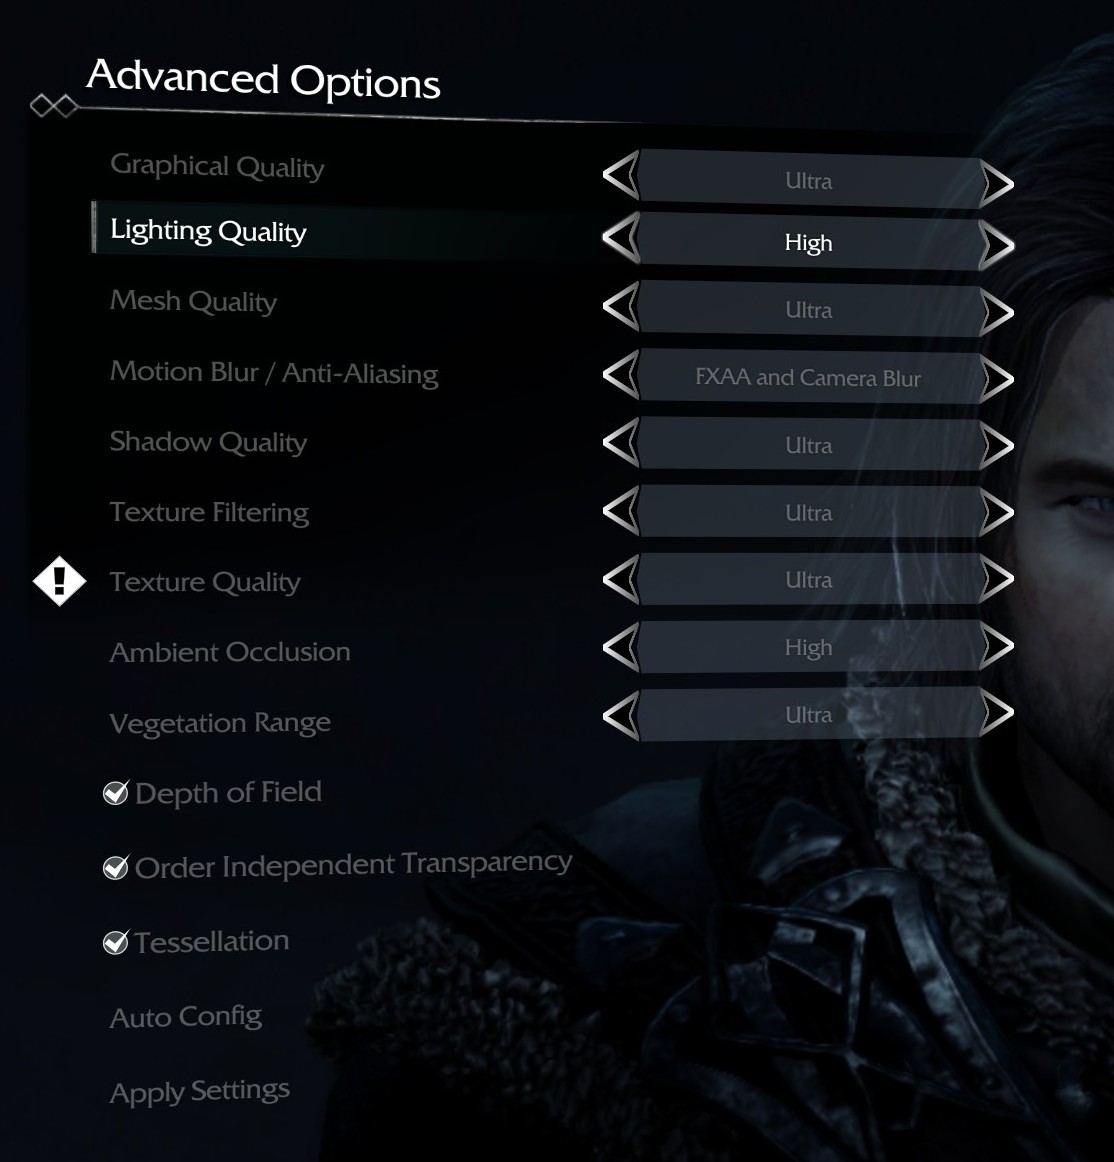
The title has an in-game benchmark, for which we run with an automated script implement the graphics settings, select the benchmark, and parse the frame-time output which is dumped on the drive. The graphics settings include standard options such as Graphical Quality, Lighting, Mesh, Motion Blur, Shadow Quality, Textures, Vegetation Range, Depth of Field, Transparency and Tessellation. There are standard presets as well.
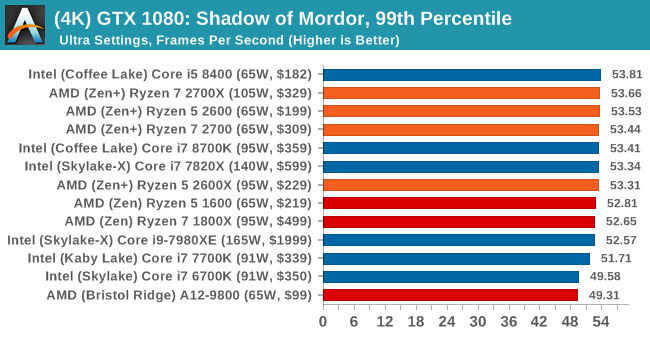
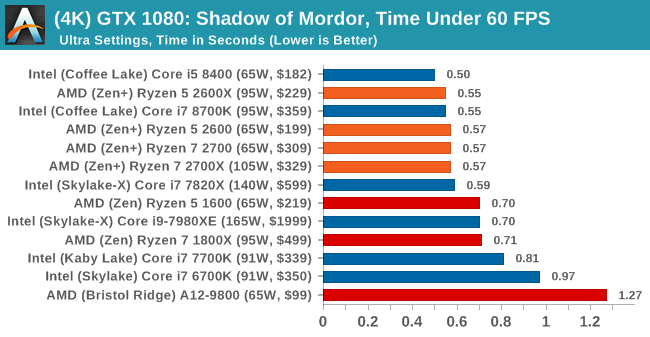
We run the benchmark at 1080p and a native 4K, using our 4K monitors, at the Ultra preset. Results are averaged across four runs and we report the average frame rate, 99th percentile frame rate, and time under analysis.
All of our benchmark results can also be found in our benchmark engine, Bench.
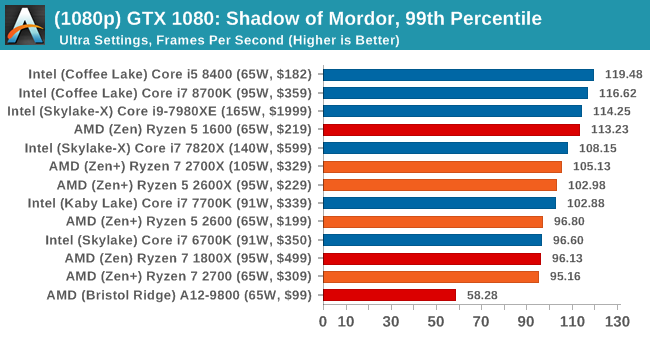
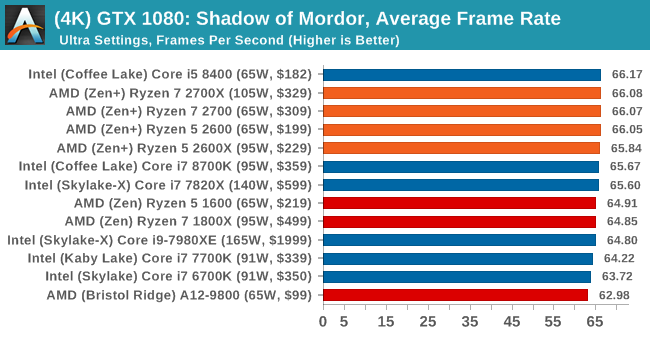
MSI GTX 1080 Gaming 8G Performance
1080p


4K


545 Comments
View All Comments
John_M - Friday, May 11, 2018 - link
And still there's nothing on the StoreMI page. What's the excuse for that?AmbroseAthan - Friday, May 18, 2018 - link
Are we really over 3.5 weeks after this was updated as TBD, and you guys have fallen this far behind?This is not the standard I feel like Anandtech normally adheres to.
klatscho - Monday, May 21, 2018 - link
I second that.Maxiking - Monday, May 21, 2018 - link
LOL, the benchmarks are now updated, Ryzen+ absolutely outperformed in games by 8700k even with Meltdown and Spectre patches. So nothing new, Ryzen is still bad.klatscho - Monday, May 21, 2018 - link
If your usecase is 1080p gaming I would agree, however the difference becomes marginal as resolution increases. Also keep in mind that the 8700k currently retails for about $20 more than the 2700x and doesn't include a cooler, which means it is overall about $50 dearer...peevee - Tuesday, May 22, 2018 - link
"and the speed is limited to how the system reads from a drive that spins at 7200 or 5400 times per second"It is PER MINUTE. As in RPM.
cvearl - Friday, June 8, 2018 - link
My 2600 X at stock does 177 in single core cinebench. But that is with h100i V2 cooler. With the default cooler it gets the same score as you 173. The cooler the chip the higher the Boost. Also out-of-the-box XMP in the Bios Works 3200 no problem. In fact cl14. Out of the box versus my 1600 X in the exact same system it is 15% faster across the board.virpuain@gmail.com - Tuesday, June 19, 2018 - link
Nice review.On thing that bothers me is the inclusion of Winrar for this review without a note stating it is a underperforming compression tool. It is know that 7zip can compress almost twice as fast as Winrar.
Not that but also the lack of consistency in between compressions tests as instead of compressing and decrompressing a set file you are taking different procedures for each benchmark. I mean the job is to compress/decompress, let the user know how it does and why it does that.
0ldman79 - Monday, July 23, 2018 - link
I realize they probably don't have an FX 6300 and 83xx system for comparison.The FX 8350 scores 23719 MIPS on the 64 MB 7zip test, a good deal higher than the Kaveri or Bristol Ridge. I need to bench my 6300 just for giggles.
mrinmaydhar - Friday, July 27, 2018 - link
Try and run a S.M.A.R.T. test on the drives. The virtual adapter is unable to provide any data and causes a Blue-Screen. At least the last time I used the Enmotus version did.