The AMD 2nd Gen Ryzen Deep Dive: The 2700X, 2700, 2600X, and 2600 Tested
by Ian Cutress on April 19, 2018 9:00 AM ESTCivilization 6
First up in our CPU gaming tests is Civilization 6. Originally penned by Sid Meier and his team, the Civ series of turn-based strategy games are a cult classic, and many an excuse for an all-nighter trying to get Gandhi to declare war on you due to an integer overflow. Truth be told I never actually played the first version, but every edition from the second to the sixth, including the fourth as voiced by the late Leonard Nimoy, it a game that is easy to pick up, but hard to master.

Benchmarking Civilization has always been somewhat of an oxymoron – for a turn based strategy game, the frame rate is not necessarily the important thing here and even in the right mood, something as low as 5 frames per second can be enough. With Civilization 6 however, Firaxis went hardcore on visual fidelity, trying to pull you into the game. As a result, Civilization can taxing on graphics and CPUs as we crank up the details, especially in DirectX 12.
Perhaps a more poignant benchmark would be during the late game, when in the older versions of Civilization it could take 20 minutes to cycle around the AI players before the human regained control. The new version of Civilization has an integrated ‘AI Benchmark’, although it is not currently part of our benchmark portfolio yet, due to technical reasons which we are trying to solve. Instead, we run the graphics test, which provides an example of a mid-game setup at our settings.
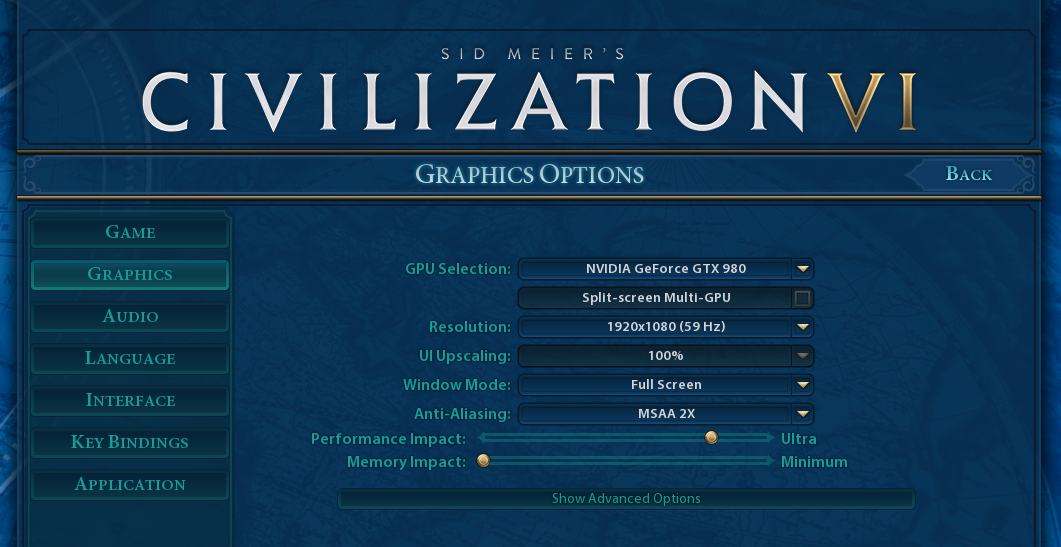
At both 1920x1080 and 4K resolutions, we run the same settings. Civilization 6 has sliders for MSAA, Performance Impact and Memory Impact. The latter two refer to detail and texture size respectively, and are rated between 0 (lowest) to 5 (extreme). We run our Civ6 benchmark in position four for performance (ultra) and 0 on memory, with MSAA set to 2x.
For reviews where we include 8K and 16K benchmarks (Civ6 allows us to benchmark extreme resolutions on any monitor) on our GTX 1080, we run the 8K tests similar to the 4K tests, but the 16K tests are set to the lowest option for Performance.
All of our benchmark results can also be found in our benchmark engine, Bench.
MSI GTX 1080 Gaming 8G Performance
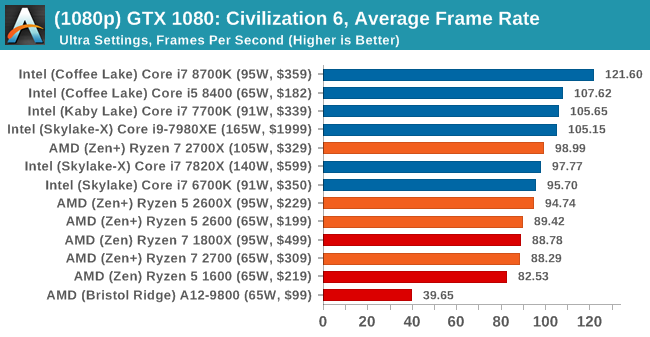
1080p


4K


8K


16K


545 Comments
View All Comments
John_M - Friday, May 11, 2018 - link
And still there's nothing on the StoreMI page. What's the excuse for that?AmbroseAthan - Friday, May 18, 2018 - link
Are we really over 3.5 weeks after this was updated as TBD, and you guys have fallen this far behind?This is not the standard I feel like Anandtech normally adheres to.
klatscho - Monday, May 21, 2018 - link
I second that.Maxiking - Monday, May 21, 2018 - link
LOL, the benchmarks are now updated, Ryzen+ absolutely outperformed in games by 8700k even with Meltdown and Spectre patches. So nothing new, Ryzen is still bad.klatscho - Monday, May 21, 2018 - link
If your usecase is 1080p gaming I would agree, however the difference becomes marginal as resolution increases. Also keep in mind that the 8700k currently retails for about $20 more than the 2700x and doesn't include a cooler, which means it is overall about $50 dearer...peevee - Tuesday, May 22, 2018 - link
"and the speed is limited to how the system reads from a drive that spins at 7200 or 5400 times per second"It is PER MINUTE. As in RPM.
cvearl - Friday, June 8, 2018 - link
My 2600 X at stock does 177 in single core cinebench. But that is with h100i V2 cooler. With the default cooler it gets the same score as you 173. The cooler the chip the higher the Boost. Also out-of-the-box XMP in the Bios Works 3200 no problem. In fact cl14. Out of the box versus my 1600 X in the exact same system it is 15% faster across the board.virpuain@gmail.com - Tuesday, June 19, 2018 - link
Nice review.On thing that bothers me is the inclusion of Winrar for this review without a note stating it is a underperforming compression tool. It is know that 7zip can compress almost twice as fast as Winrar.
Not that but also the lack of consistency in between compressions tests as instead of compressing and decrompressing a set file you are taking different procedures for each benchmark. I mean the job is to compress/decompress, let the user know how it does and why it does that.
0ldman79 - Monday, July 23, 2018 - link
I realize they probably don't have an FX 6300 and 83xx system for comparison.The FX 8350 scores 23719 MIPS on the 64 MB 7zip test, a good deal higher than the Kaveri or Bristol Ridge. I need to bench my 6300 just for giggles.
mrinmaydhar - Friday, July 27, 2018 - link
Try and run a S.M.A.R.T. test on the drives. The virtual adapter is unable to provide any data and causes a Blue-Screen. At least the last time I used the Enmotus version did.