The AMD 2nd Gen Ryzen Deep Dive: The 2700X, 2700, 2600X, and 2600 Tested
by Ian Cutress on April 19, 2018 9:00 AM ESTShadow of Mordor
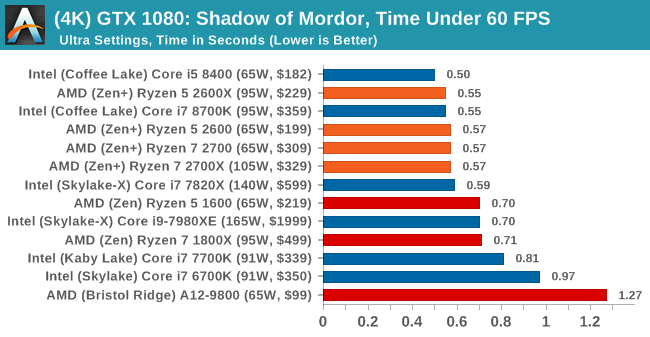
The next title in our testing is a battle of system performance with the open world action-adventure title, Middle Earth: Shadow of Mordor (SoM for short). Produced by Monolith and using the LithTech Jupiter EX engine and numerous detail add-ons, SoM goes for detail and complexity. The main story itself was written by the same writer as Red Dead Redemption, and it received Zero Punctuation’s Game of The Year in 2014.

A 2014 game is fairly old to be testing now, however SoM has a stable code and player base, and can still stress a PC down to the ones and zeroes. At the time, SoM was unique, offering a dynamic screen resolution setting allowing users to render at high resolutions that are then scaled down to the monitor. This form of natural oversampling was designed to let the user experience a truer vision of what the developers wanted, assuming you had the graphics hardware to power it but had a sub-4K monitor.
The title has an in-game benchmark, for which we run with an automated script implement the graphics settings, select the benchmark, and parse the frame-time output which is dumped on the drive. The graphics settings include standard options such as Graphical Quality, Lighting, Mesh, Motion Blur, Shadow Quality, Textures, Vegetation Range, Depth of Field, Transparency and Tessellation. There are standard presets as well.
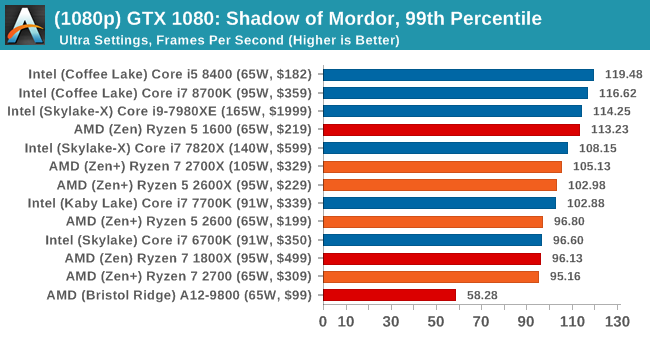
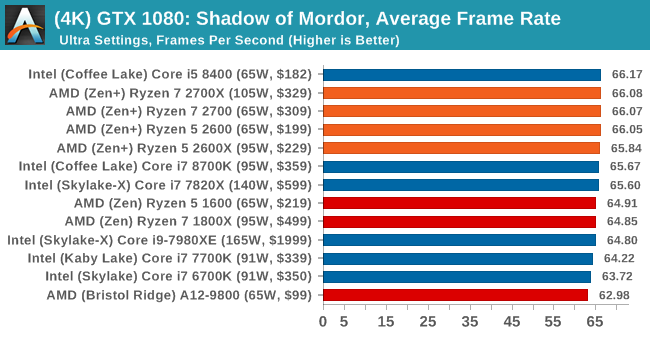
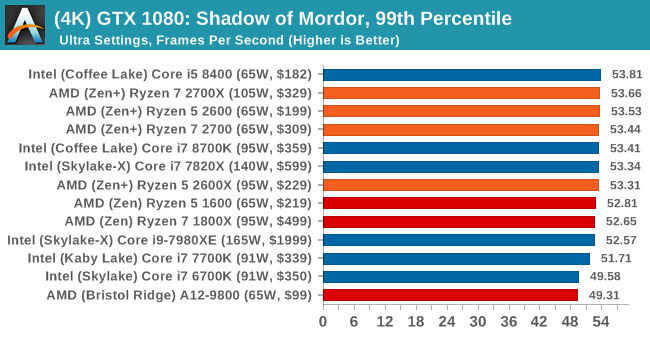
We run the benchmark at 1080p and a native 4K, using our 4K monitors, at the Ultra preset. Results are averaged across four runs and we report the average frame rate, 99th percentile frame rate, and time under analysis.
All of our benchmark results can also be found in our benchmark engine, Bench.
MSI GTX 1080 Gaming 8G Performance
1080p


4K


545 Comments
View All Comments
jor5 - Thursday, April 26, 2018 - link
Pull this shambles and repost when you've corrected it fully.mapesdhs - Monday, May 14, 2018 - link
Not an argument. It is just as interesting to learn about how and why this issue occured, to understand the nature of benchmarking. Life isn't just about being spoonfed end nuggets of things, the process itself is relevant. Or would you rather we don't learn from history?peevee - Thursday, April 26, 2018 - link
When 65W i7 8700 is 15% faster in Octane 2.0 than 105W Rizen 7 2700x, it is just sad.Of course, the horrible x64 practically demands than compilers must optimize for a very specific CPU implementation (choosing and sorting instructions in the code accordingly), AMD could have at least realized the fact and optimize their own implementation for the same Intel-optimized code generators...
GreenReaper - Thursday, April 26, 2018 - link
Intel compilers and libraries tend not to use the ideal instructions unless they detect a GenuineIntel signature via CPUID - it'll likely use the default lowest-common-denominator pathway instead.TDP is more of a guideline - it doesn't determine actual power usage (we've seen Coffee Lake use way more than the TDP), let alone the power used in a particular operation. Having said that, I wouldn't be surprised if Intel were more efficient in this particular test. But it'd be interesting to know how much impact Meltdown patches have in that area; they might well increase the amount of time the CPU spends idle (but not idle enough to go into a sleep mode) as it waited to fetch instructions.
SaturnusDK - Thursday, April 26, 2018 - link
Compare power consumption to blender score. Ryzen is about 9% more power efficient.TDP is literally Thermal Design Power. It has nothing to do with power consumption.
peevee - Thursday, April 26, 2018 - link
"TDP is literally Thermal Design Power. It has nothing to do with power consumption."Unless you have invented a way to overcome energy conservation law, power consumed = power dissipated.
SaturnusDK - Friday, April 27, 2018 - link
It's a guideline for cooling solutions. Look at the power consumption numbers in this test for example.Ryzen 2700X power consumption under full load 110W.
Intel i7 8700K power consumption under full load 120W.
Both are at stock speeds with the Ryzen having 8 cores versus 6 cores, and scoring 2700X 24% higher Cinebench scores. Ryzen is rated at 105W TDP so actual power consumption at stock speed is pretty close. The 8700K uses 120W so it's pretty far from the 95W TDP it is rated at.
ijdat - Saturday, April 28, 2018 - link
The 8700 also uses 120W so it's even further from the 65W TDP it's rated at. In comparison Ryzen 2700 uses 45W when it has the same rated 65W TDP. I know which one I'd prefer to put into a quiet low-power system...mapesdhs - Monday, May 14, 2018 - link
Perhaps this is AMD's biggest win this time round, potent HTPC setups.peevee - Thursday, April 26, 2018 - link
"Intel compilers "What Intel compilers have to do with it?