The AMD 2nd Gen Ryzen Deep Dive: The 2700X, 2700, 2600X, and 2600 Tested
by Ian Cutress on April 19, 2018 9:00 AM ESTShadow of Mordor
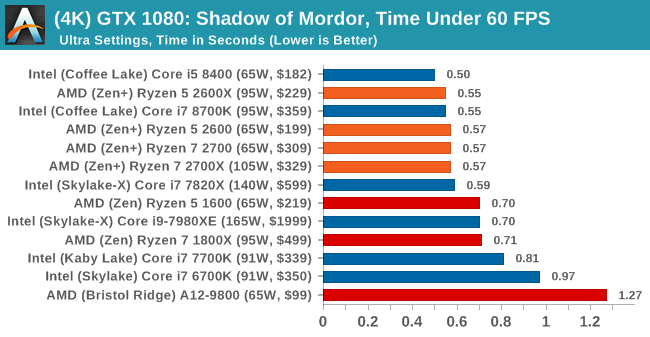
The next title in our testing is a battle of system performance with the open world action-adventure title, Middle Earth: Shadow of Mordor (SoM for short). Produced by Monolith and using the LithTech Jupiter EX engine and numerous detail add-ons, SoM goes for detail and complexity. The main story itself was written by the same writer as Red Dead Redemption, and it received Zero Punctuation’s Game of The Year in 2014.

A 2014 game is fairly old to be testing now, however SoM has a stable code and player base, and can still stress a PC down to the ones and zeroes. At the time, SoM was unique, offering a dynamic screen resolution setting allowing users to render at high resolutions that are then scaled down to the monitor. This form of natural oversampling was designed to let the user experience a truer vision of what the developers wanted, assuming you had the graphics hardware to power it but had a sub-4K monitor.
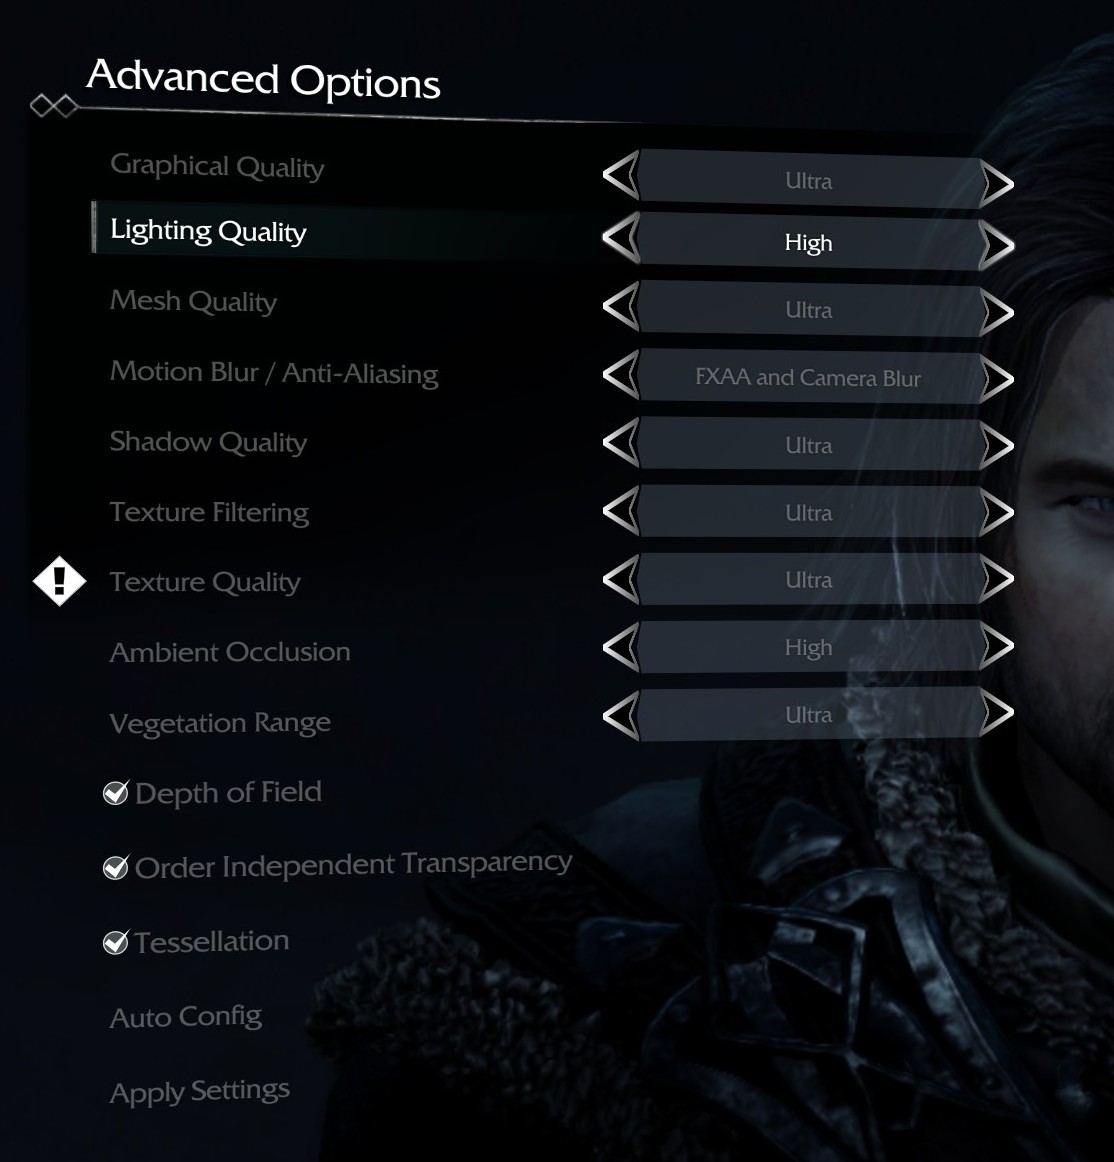
The title has an in-game benchmark, for which we run with an automated script implement the graphics settings, select the benchmark, and parse the frame-time output which is dumped on the drive. The graphics settings include standard options such as Graphical Quality, Lighting, Mesh, Motion Blur, Shadow Quality, Textures, Vegetation Range, Depth of Field, Transparency and Tessellation. There are standard presets as well.
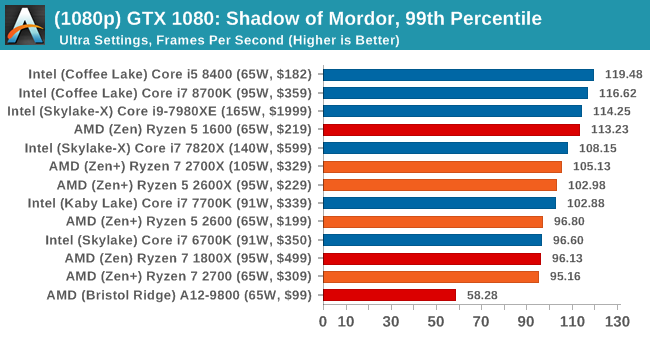
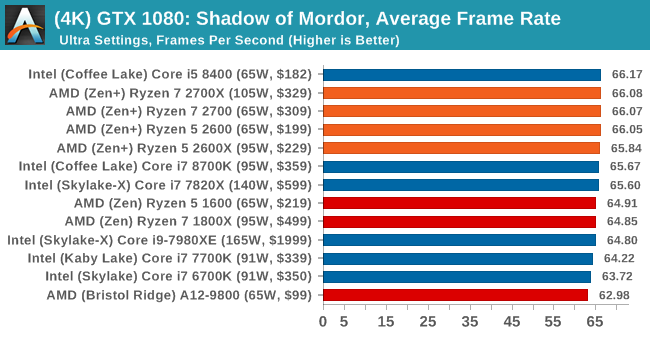
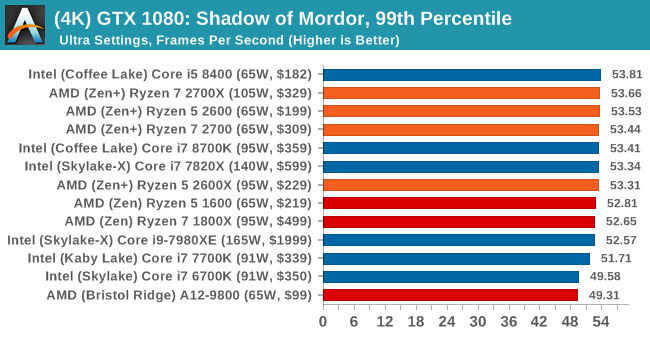
We run the benchmark at 1080p and a native 4K, using our 4K monitors, at the Ultra preset. Results are averaged across four runs and we report the average frame rate, 99th percentile frame rate, and time under analysis.
All of our benchmark results can also be found in our benchmark engine, Bench.
MSI GTX 1080 Gaming 8G Performance
1080p


4K


545 Comments
View All Comments
Luckz - Monday, April 23, 2018 - link
PB2/XFR2 seems to be all the overclocking anyone would want to do on Ryzen 2xxx (besides LN2 and other non-sustainable things)werpu - Friday, April 20, 2018 - link
Ahem those initial results were meltdown only and January, there have been a boatload of fixes since then on both the meltdown and spectre side. So the data is not correct anymore. Even in January VMs etc.. everything I/O intensive already encountered a serious performance hit.Crazyeyeskillah - Friday, April 20, 2018 - link
Those reviews haven't rerun the intel chip parts, hence the dated data.Azix - Thursday, April 19, 2018 - link
They used a 1080 in these tests. maybe thats a factor5080 - Thursday, April 19, 2018 - link
I think what you're seeing with the other reviews is old database information being used without the spectre and meltdown patches. They only say that Ryzen+ was tested with the latest patches, but it dosn't say that they retested all the Intel systems with the BIOS fix and patches applied.Ryan Smith - Thursday, April 19, 2018 - link
All of our Intel systems were re-run with the full Smeltdown fixes for this review.wicketr - Thursday, April 19, 2018 - link
It's be interesting to have an article running all these tests pre and post patches to show how much they affect the system. There seems to be a lot of confusion about how bad it is.Ryan Smith - Thursday, April 19, 2018 - link
It's definitely something we're intending to mine from the data later, after we're over this launch hump.5080 - Thursday, April 19, 2018 - link
That's what I thought and what Chris113q doesn'r realize.hescominsoon - Thursday, April 19, 2018 - link
Chris,You need to take into account the latest system/bios patches for meltdown/spectre as well. Anandtech is not manipulating the results. Just because they get "different" results from "everybody else"(especially when you fail to cite the differences), strains your credibility.