Meltdown & Spectre: Analyzing Performance Impacts on Intel's NUC7i7BNH
by Ganesh T S on March 23, 2018 4:15 PM EST- Posted in
- Systems
- Spectre
- Benchmarks
- Meltdown
Miscellaneous Benchmarks
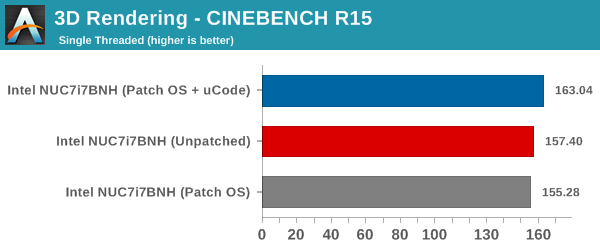
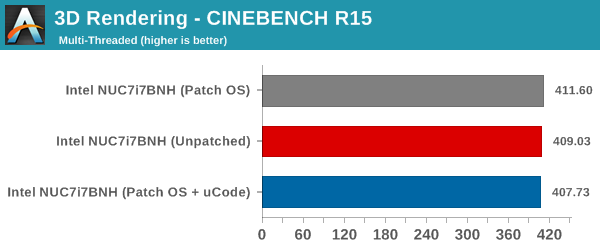
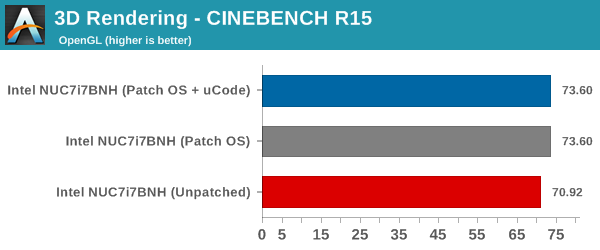
CINEBENCH R15 is our benchmark of choice for 3D rendering. It provides three benchmark modes - OpenGL, single threaded and multi-threaded. This benchmark is largely unaffected by the patching. All the recorded numbers are within the margin of expected errors from one run to another.
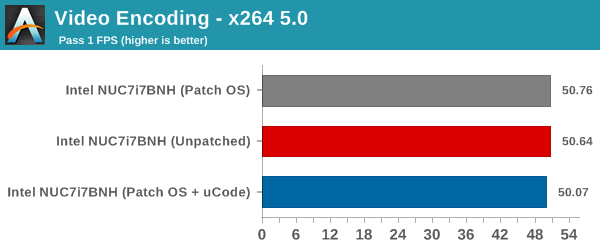
x264 v5.0 is another benchmark that is unaffected by the Meltdown and Spectre patches.

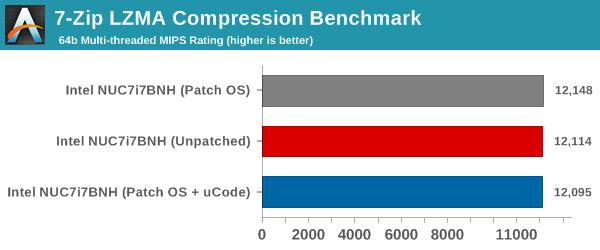
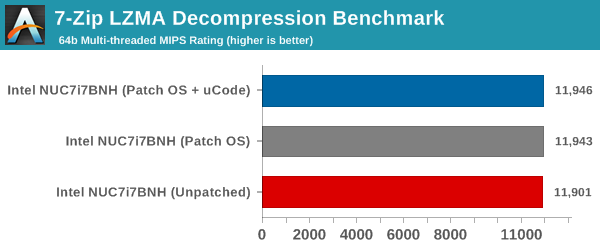
7-Zip is a very effective and efficient compression program, often beating out OpenCL accelerated commercial programs in benchmarks even while using just the CPU power. 7-Zip has a benchmarking program that provides tons of details regarding the underlying CPU's efficiency. In our benchmark suite, we are interested in the compression and decompression MIPS ratings when utilizing all the available threads. This benchmark also remains unaffected, with the results happening to be within the margin of error from run to run.
Agisoft PhotoScan is a commercial program that converts 2D images into 3D point maps, meshes and textures. The program designers sent us a command line version in order to evaluate the efficiency of various systems that go under our review scanner. The command line version has two benchmark modes, one using the CPU and the other using both the CPU and GPU (via OpenCL). We have been using an old version of the program with 50 photographs in our reviews till now. The updated benchmark (v1.3) now takes around 84 photographs and does four stages of computation:
- Stage 1: Align Photographs (capable of OpenCL acceleration)
- Stage 2: Build Point Cloud (capable of OpenCL acceleration)
- Stage 3: Build Mesh
- Stage 4: Build Textures
We record the time taken for each stage. Since various elements of the software are single threaded, others multithreaded, and some use GPUs, it is a very relevant benchmark from a media editing and content creation perspective.
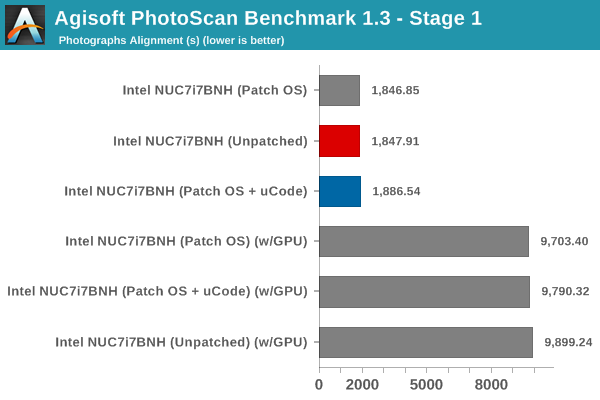
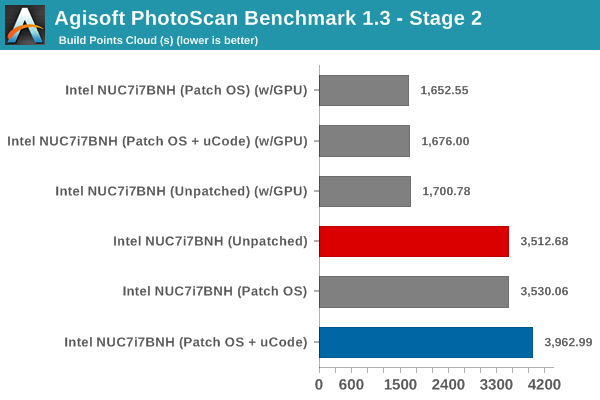

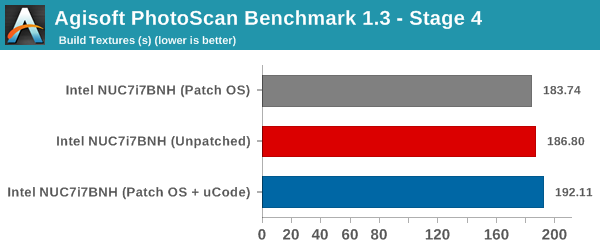
Since this is a real-world benchmark, we can see performance impacts in some of the stages. While the first and last ones do not have any significant deviation, stages 2 and 3 are worse off by around 12.8% and 6.8% respectively in the non-GPU case.
The benchmarks section wraps up with the new Dolphin Emulator (v5) benchmark mode results. This is again a test of the CPU capabilities, but, we don't see much impact on the performance from the patching. The bennchmark consistently took around 325 seconds in all three patching configurations.


83 Comments
View All Comments
Drazick - Saturday, March 24, 2018 - link
This is perfect!Thank You.
nocturne - Friday, March 23, 2018 - link
I'm wondering why there were different builds of windows tested, when the patches can be disabled via a simple powershell command. Performance can vary wildly for synthetic tests across subsequent builds, especially with insider builds.I can understand how this comparison gives you the /before and after/, but testing across different builds doesn't show you anything about the performance impact of the patches themselves.
ganeshts - Saturday, March 24, 2018 - link
BIOS patches (CPU microcode) can't be turned off from within the OS. But, I did use the InSpectre utility to do quick testing of the extensively affected benchmarks across all the builds (as applicable). The performance loss in those benchmarks were consistent with what we got with the final build (309) in a fully patched state (BIOS v0062).By the way, none of these builds are insider builds.
The reason we have listed these versions is just to indicate the build used to collect comprehensive data for the configuration.
The builds vary because the testing was done over the course of two months, as Intel kept revising their fix and MS also had to modify some of their patches.
ಬುಲ್ವಿಂಕಲ್ ಜೆ ಮೂಸ್ - Saturday, March 24, 2018 - link
Futuremark Storage Bench>Why are you getting 312MB/s (unpatched) bandwith for a drive that has an average read speed of 1000MB/s ?
Please clarify why this synthetic test has any basis in fact
ಬುಲ್ವಿಂಕಲ್ ಜೆ ಮೂಸ್ - Saturday, March 24, 2018 - link
I'm only asking this because I have been getting real world results that have little relationship to a synthetic testsFor example, simply swapping a CPU from a 2.6Ghz dualcore to a 3.3 Ghz quadcore while keeping all other hardware and software the same will add a couple seconds to my boot times (same O.S.)
Now, I never expected a faster quadcore to take longer to boot but it does
Is there more overhead as you add cores and could this be measured with a synthetic test?
Do you believe the synthetic test is actually measuring the bandwidth of the SSD, or how fast the CPU can process the data coming from the SSD?
How would this differ from a real world test?
hyno111 - Sunday, March 25, 2018 - link
Futuremark Storage Benchmark used real world load to test the overall disk throughput. The official sequential r/w speed does not represent actual use cases and is used for mainly for advertising.ಬುಲ್ವಿಂಕಲ್ ಜೆ ಮೂಸ್ - Sunday, March 25, 2018 - link
"Futuremark Storage Benchmark used real world load to test the overall disk throughput."----------------------------------------------------------------------------------------------------------------------
O.K., except my point was you are not measuring the disk throughput which would stay the same regardless of slowdowns in the processor
You are testing how fast the processor can handle the data coming from the disk "sorta"
The synthetic test would still not tell me that my faster quadcore would boot slower than my dualcore in the example given, therefore it also does not directly relate to a real world test
The disk hasn't changed and neither has it's actual throughput
ಬುಲ್ವಿಂಕಲ್ ಜೆ ಮೂಸ್ - Sunday, March 25, 2018 - link
"The synthetic test would still not tell me that my faster quadcore would boot slower than my dualcore in the example given, therefore it also does not directly relate to a real world test"-----------------------------------------------------------------------------------------------------------
Before you answer, I admit that the example above does not tell me the actual throughput of the disk.
It is used to show that the synthetic test does not directly relate to the results you might get in a real world test, yet both my example and AnandTech's example do not show the actual disk throughput which stays the same
akula2 - Saturday, March 24, 2018 - link
I do not have an iota of doubt that all these so-called vulnerabilities are well thought and deliberately pre-planned by the Deep State during the CPU architecture design stage. The result is huge loss of thrust in the brands like Intel who were/are part of this epic shamelessness! I'm pretty sure some of the tech media houses are in part of this syndicate willingly or not. Now, I do not give any benefit of doubt to AMD either.The gigantic problem: what is the alternative? The answer lies in nation taking the lead to setup companies away from the influence of Deep State, ideally in Asia.
FullmetalTitan - Saturday, March 24, 2018 - link
I thought I only had to deal with everyone's favorite Anandtech loony, but now we have the conspiracy nuts in here too?Can we get some forum moderation please?