Marrying Vega and Zen: The AMD Ryzen 5 2400G Review
by Ian Cutress on February 12, 2018 9:00 AM ESTBenchmarking Performance: CPU System Tests
Our first set of tests is our general system tests. These set of tests are meant to emulate more about what people usually do on a system, like opening large files or processing small stacks of data. This is a bit different to our office testing, which uses more industry standard benchmarks, and a few of the benchmarks here are relatively new and different.
All of our benchmark results can also be found in our benchmark engine, Bench.
PDF Opening
First up is a self-penned test using a monstrous PDF we once received in advance of attending an event. While the PDF was only a single page, it had so many high-quality layers embedded it was taking north of 15 seconds to open and to gain control on the mid-range notebook I was using at the time. This put it as a great candidate for our 'let's open an obnoxious PDF' test. Here we use Adobe Reader DC, and disable all the update functionality within. The benchmark sets the screen to 1080p, opens the PDF to in fit-to-screen mode, and measures the time from sending the command to open the PDF until it is fully displayed and the user can take control of the software again. The test is repeated ten times, and the average time taken. Results are in milliseconds.
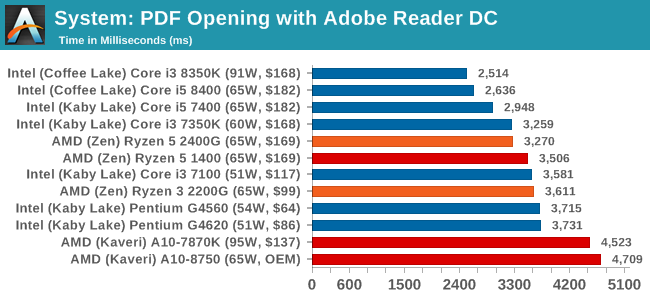
Our PDF test relies mostly on single core frequency, but memory frequency can also help. The 2400G pips the 1400, and the older AMD processors take a back seat. This is the sort of test that Intel's 4.2 GHz chips can take advantage off, as shown by the Core i3-8350K.
FCAT Processing: link
One of the more interesting workloads that has crossed our desks in recent quarters is FCAT - the tool we use to measure stuttering in gaming due to dropped or runt frames. The FCAT process requires enabling a color-based overlay onto a game, recording the gameplay, and then parsing the video file through the analysis software. The software is mostly single-threaded, however because the video is basically in a raw format, the file size is large and requires moving a lot of data around. For our test, we take a 90-second clip of the Rise of the Tomb Raider benchmark running on a GTX 980 Ti at 1440p, which comes in around 21 GB, and measure the time it takes to process through the visual analysis tool.
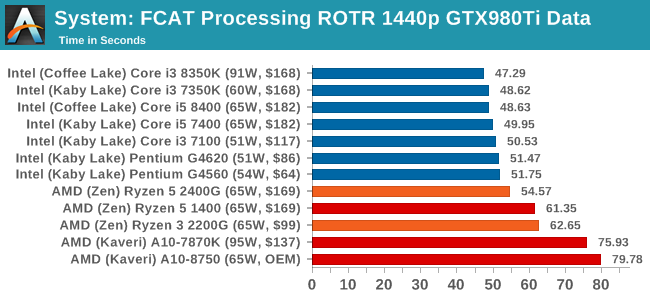
The FCAT program is single threaded, so again Intel's chips take a win here. The Ryzen 5 2400G takes another chunk out of the Ryzen 5 1400, due to its higher frequency.
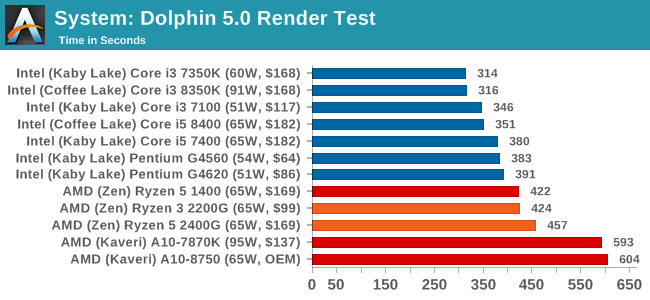
Dolphin Benchmark: link
Many emulators are often bound by single thread CPU performance, and general reports tended to suggest that Haswell provided a significant boost to emulator performance. This benchmark runs a Wii program that ray traces a complex 3D scene inside the Dolphin Wii emulator. Performance on this benchmark is a good proxy of the speed of Dolphin CPU emulation, which is an intensive single core task using most aspects of a CPU. Results are given in seconds, where the Wii itself scores 1,052 seconds (17.53 minutes).
3D Movement Algorithm Test v2.1: link
This is the latest version of the self-penned 3DPM benchmark. The goal of 3DPM is to simulate semi-optimized scientific algorithms taken directly from my doctorate thesis. Version 2.1 improves over 2.0 by passing the main particle structs by reference rather than by value, and decreasing the amount of double->float->double recasts the compiler was adding in. It affords a ~25% speed-up over v2.0, which means new data.
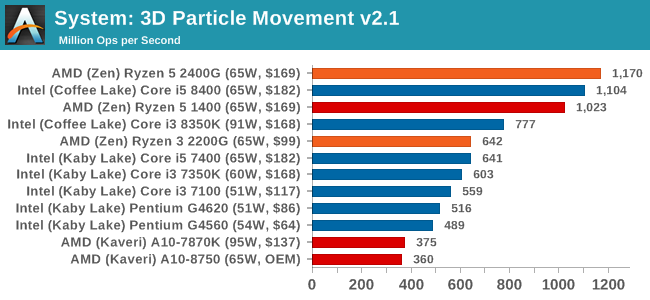
3DPM is our first multi-threaded test, and the Ryzen 5 2400G powers ahead over the 1400 due to frequency, and ahead the Core i3-8350K due to thread count. This is a benchmark that can take advantage of multithreading, so the quad-core APU with eight threads pushes ahead of the six-core Intel Core i5-8400.
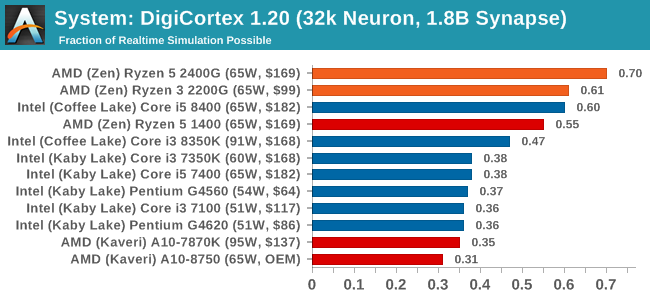
DigiCortex v1.20: link
Despite being a couple of years old, the DigiCortex software is a pet project for the visualization of neuron and synapse activity in the brain. The software comes with a variety of benchmark modes, and we take the small benchmark which runs a 32k neuron/1.8B synapse simulation. The results on the output are given as a fraction of whether the system can simulate in real-time, so anything above a value of one is suitable for real-time work. The benchmark offers a 'no firing synapse' mode, which in essence detects DRAM and bus speed, however we take the firing mode which adds CPU work with every firing.
Agisoft Photoscan 1.3.3: link
Photoscan stays in our benchmark suite from the previous version, however now we are running on Windows 10 so features such as Speed Shift on the latest processors come into play. The concept of Photoscan is translating many 2D images into a 3D model - so the more detailed the images, and the more you have, the better the model. The algorithm has four stages, some single threaded and some multi-threaded, along with some cache/memory dependency in there as well. For some of the more variable threaded workload, features such as Speed Shift and XFR will be able to take advantage of CPU stalls or downtime, giving sizeable speedups on newer microarchitectures.
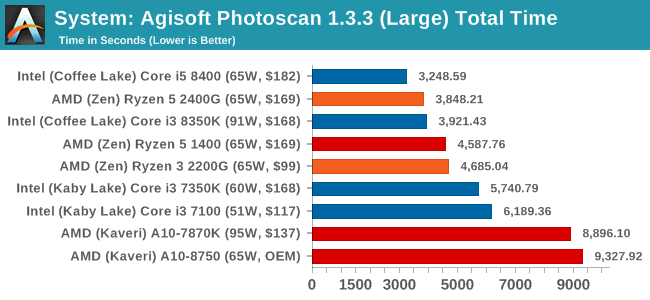
For Photoscan, certain elements of the algorithms require full cores to get the best performance, hence why the six-core CPU comes top and the Ryzen 5 2400G and Core i3-8350K are matched. That being said, the multithreading of the 2400G outweighs the extra frequency of the 8350K.


177 Comments
View All Comments
Hurr Durr - Monday, February 12, 2018 - link
I don`t care about these. I want to see how AMD is holding up in notebooks, 15W range specifically.Hul8 - Monday, February 12, 2018 - link
For a low-end graphics part like this, it would be really interesting to have a section in the review exploring the "comfortable" settings in various games.It could be really useful information for potential buyers to know what kind of settings they'd need to run in a game to reach their preferred performance level (99th percentile), whether it's 30, 45 or 60 fps, and also to know if a product simply can't reach certain performance no matter how low you turn the settings.
DrizztVD - Monday, February 12, 2018 - link
Why do you only report total power consumption? I'd like to see power efficiency!!! Since I don't know what the performance per CPU is, these power measurements mean almost nothing. Also, the efficiency will change with the workload, so Prime95 is a very one-dimensional test of efficiency. Look at your power measurement graphs: they tell you what we already know - single core speeds are lower for Ryzen, and lower TDP CPUs use less power. That's kinda duh...JHBoricua - Monday, February 12, 2018 - link
I'm confused. The AMD vs. AMD section led me to believe there was going to be a comparison of Raven Ridge against Bristol Ridge APUs, which makes sense as it would have allow the use of the same motherboard for both APUs, even if the Bristol Ridge DDR4 memory was clocked slower. But then actual benchmarks is showing Kaveri parts?prtskg - Tuesday, February 13, 2018 - link
Kaveri was better at gaming/performance than Bristol. The latter had the advantage of efficiency.nwarawa - Monday, February 12, 2018 - link
Comparing with a competitive Intel platform with dGPU is kinda tricky right now. It's not just the dGPUs that are ridiculously priced right now. RAM is too. And to maximize performance on the R7 2400G, you WILL need to spend more than the basic $90 8GB 2400 kit. The cheapest 16GB Samsung b-die 3200 kit I found was $220. And you will want to go with a 16GB kit, because already some newer games use more than 8GB, and they use MORE when using graphics cards with less than 4GB. The iGPU takes some of that 8GB for itself...if runs out of system RAM, it has to use your system disk... enjoy the single digit frame rates...Here is what I found on newegg:
INTEL
$130 - i3-8100
$90 - 8GB 2400 RAM (or 170 for 16GB)
$120 - Z370 motherboard (no mainsteam chipset YET)
===
$340
AMD
$170 - R5 2400g
$220 - 16GB 3200C14 RAM
$80 - Motherboard(cheapest decently reviewed AM4)
===
$470
The intel system is a full $130 cheaper (or $50 if you spring for the 16GB), and that gap will only increase with the upcoming cheaper chipsets and/or upcoming coffee lake models. Now, I haven't included the dGPU yet, but the GTX1050 2GB currently goes for $150 - making the Intel system total only $20 more than than AMD system, and running rings around it in most games (although neither would be ideal for the latest games... the 2GB-GPU/8GB-SYSRAM Intel system would run out of memory and the Vega 11 just doesn't have the horsepower).
What would put things in favor of AMD would be if they made clear that the iGPU would still be of use when using a dGPU (such as with the new "ThueAudioNext") in the future.
What I would REALLY like to see, though, is AMD use the beefier Vega iGPUs Intel is using with their own 12nm Zen+ chips and slap on some HBM memory. THAT I could go for.
oleyska - Monday, February 12, 2018 - link
Jeez,1.\ HBM on budget chips pushes them into 250$ range by just adding HBM.
2.\ IGP solutions are not a GTX1060 replacement, it's not magic.
System comparison:
I3 8100 is inferior in cpu tasks.
it has half the memory (intel IGP still uses memory you know?, it's configurable on both systems.
The benchmarked system runs at 2933, not 3200 so o.0
it has inferior gpu 3X~
even at same memory speeds it would still be 2X as slow, slower cpu.
So what is the point of the argument ?
It not needed to have the extra memory frequency but if you want to replace a 80$ dedicated gpu you need to and definitely add 8gb extra memory and that's where the cost comes into place as a valid comparison if you subtract 20$ from AMD for 2933 ~
add 80-100$ for GT1030 you still end up with an intel rig with higher system power consumption, equal gaming performance, inferior cpu and you will have to buy a G-sync monitor if you want tearing free monitor while freesync is thrown at ya at any price range as an added bonus.
systems are comparable and Intel's I3 line is destroyed along amd's old R3 line too.
I5,I7 and R5 stands tall still and the R7 has it's place at times too.
nwarawa - Monday, February 12, 2018 - link
Did you not even read my post? Or the review for that matter? Did you think AT ALL about the real life application of anything said before posting? "I3 8100 is inferior in cpu tasks" WHAT tasks? I'll answer that for you. Rendering. If you are trying to get the cheapest CPU possible for rendering with as little RAM as possible to shave as much money off as possible... you are doing it wrong. Since we (or at least I am... not sure what you are going on about) are talking about GPUs, you can safely assume we are concerned about GAMES."it has half the memory" no s--t, sherlock, read the post again (or for the first time, apparently)
I could go on, but apparently you were just scouring the posts for someone to disagree with with a pre-defined little rant, so I won't bother.
Fritzkier - Monday, February 12, 2018 - link
Why you need 16GB? if you bought Ryzen APU, you probably only plays e-sport title anyway and some older games... E-sport titles doesn't need a huge RAM. And it already crush the intel counterparts, both in performance and price.You guys from first world countries are always complaining. Jeez. Try to live at poorer countries like South East Asia.
serendip - Tuesday, February 13, 2018 - link
An APU at $100 would still be expensive, especially when people in the developing world build machines with Pentium G chips. The speedy APU graphics would negate the need for a low-end discrete GPU though.