The Intel Core i9-7980XE and Core i9-7960X CPU Review Part 1: Workstation
by Ian Cutress on September 25, 2017 3:01 AM ESTAnalyzing Performance Per Dollar
While measuring the performance per watt is an interesting metric, workstation processors are at the top of the stack when it comes to power consumption: the point of these processors (typically) is getting work done fast, and their users don't mind using a bit more power to get there. When it comes to designing a workstation level system for an office, the person who signs off on the project is not going to look at the performance per watt - they are going to look at the performance per dollar. Does this purchase represent the best value for the environment, and is the purchase likely to give us the best return? The following graphs attempt to answer that information, and we've chosen a varied selection including variable threaded loads.
For this analysis, we've taken all of the processors we have tested from what Intel has launched in 2017. This covers all of the consumer level Kaby Lake-S i7 and i5 parts (except T), the high-end desktop Kaby Lake-X processors, and all the high-end Skylake-X desktop parts. This is represented in the graphs in blue under the 'Intel 2017' title. From AMD, we have all eleven AMD Ryzen processors tested, under the red line.
Compile Performance Per Dollar
One of our popular benchmarks is our compile test. This takes a fixed version of Chromium v56, and runs it through the MSVC compiler with linking as per the directions given on by the Chromium developers. A typical test can run from 40 minutes to 3 hours depending on the processor, and taxes the single thread, the multi-thread and the memory performance of the system. We've seen that it does not particularly take kindly to processors with victim caches, such as Skylake-X or AMD Ryzen, with limited scaling on the code workflow. Despite the per-core performance dip from Skylake-S to Skylake-X, the top processor still has the best absolute performance. Converting our data to the number of compiles per day per dollar gives the following graph:

The cheaper end of the graph is surprisingly high, dominated by Intel's dual-core Pentium (with hyperthreading) being offered for super low prices. In the standard 'consumer' price range below $300, the mid-range Ryzen processors have a slight advantage, but, beyond the Ryzen 7 1700, Intel has the performance per dollar advantage all the way out to $2000.
Agisoft Performance Per Dollar
The Agisoft Photoscan software has been a key part of our performance testing for several years, demonstrating a true office workflow: archival purposes of taking 2D photos and converting them into 3D models. This is a computationally interesting algorithm, involving multiple single-threaded and multi-threaded stages.
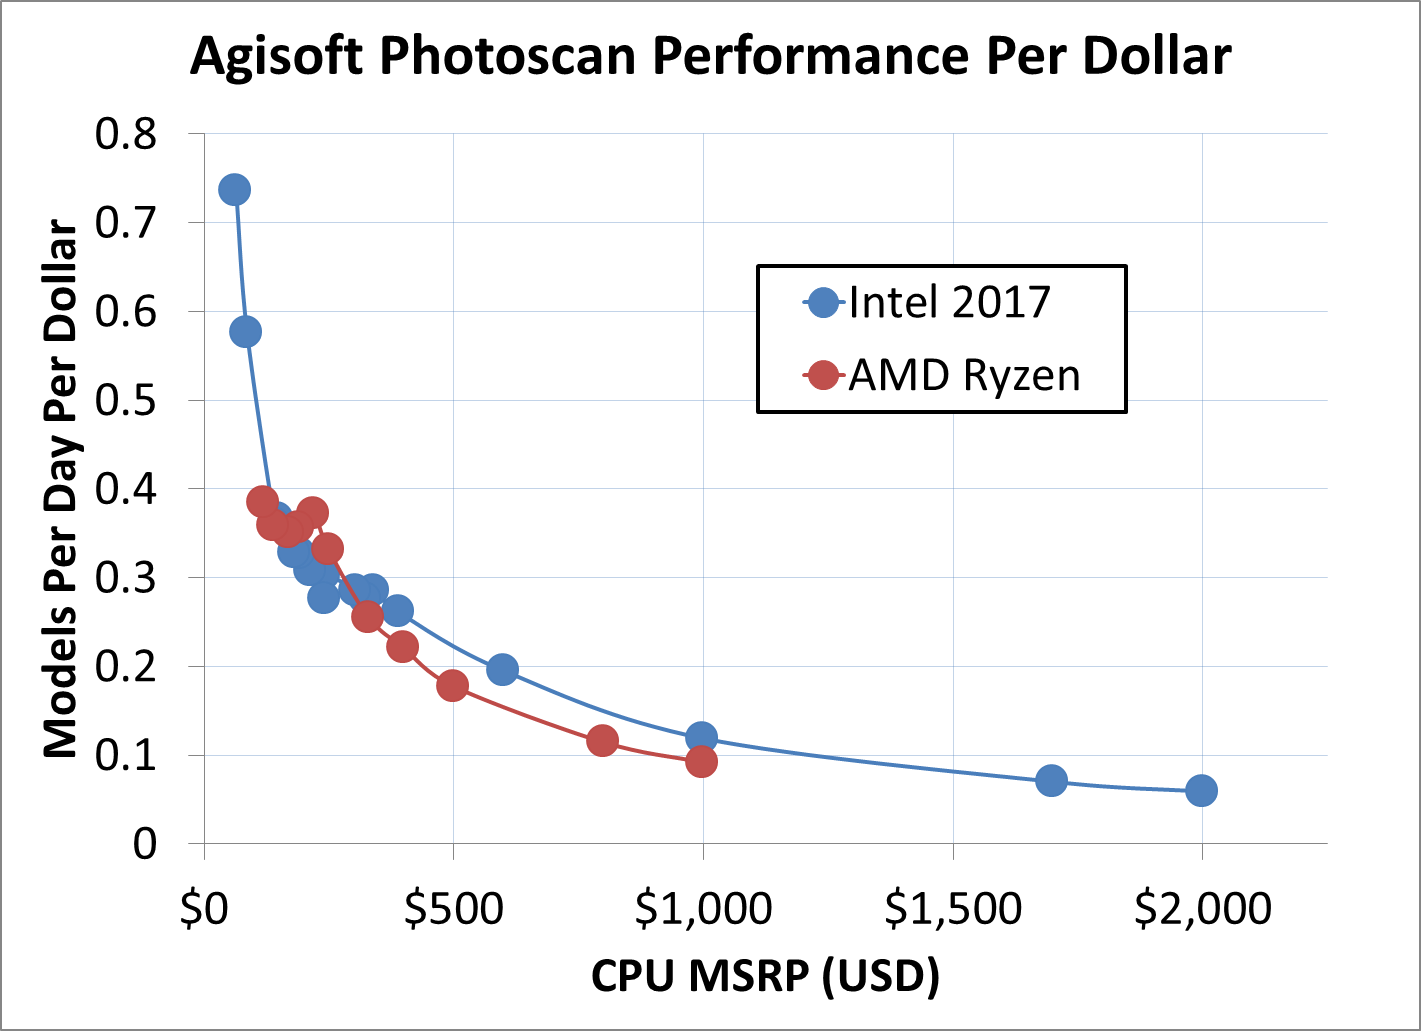
Due to the single threaded elements of the algorithm, linear scaling is not observed as we ramp up through the core counts. At the mid-range consumer processor pricing, the twelve-thread Ryzen 5 processors sit above the quad-thread Core i5 parts, but beyond $330 or so, as we move into Intel's quad-core offerings and above, the performance per dollar is solely on Intel's side.
Blender Performance Per Dollar
The Blender benchmark has been an interesting debate in the last few months, with the new architectures from Intel and AMD pushing updates into the code for faster rendering. Our test takes a well used Blender release and one of the standard benchmarks (rather than anything vendor specified). Results are given in renders of this benchmark per day per dollar.
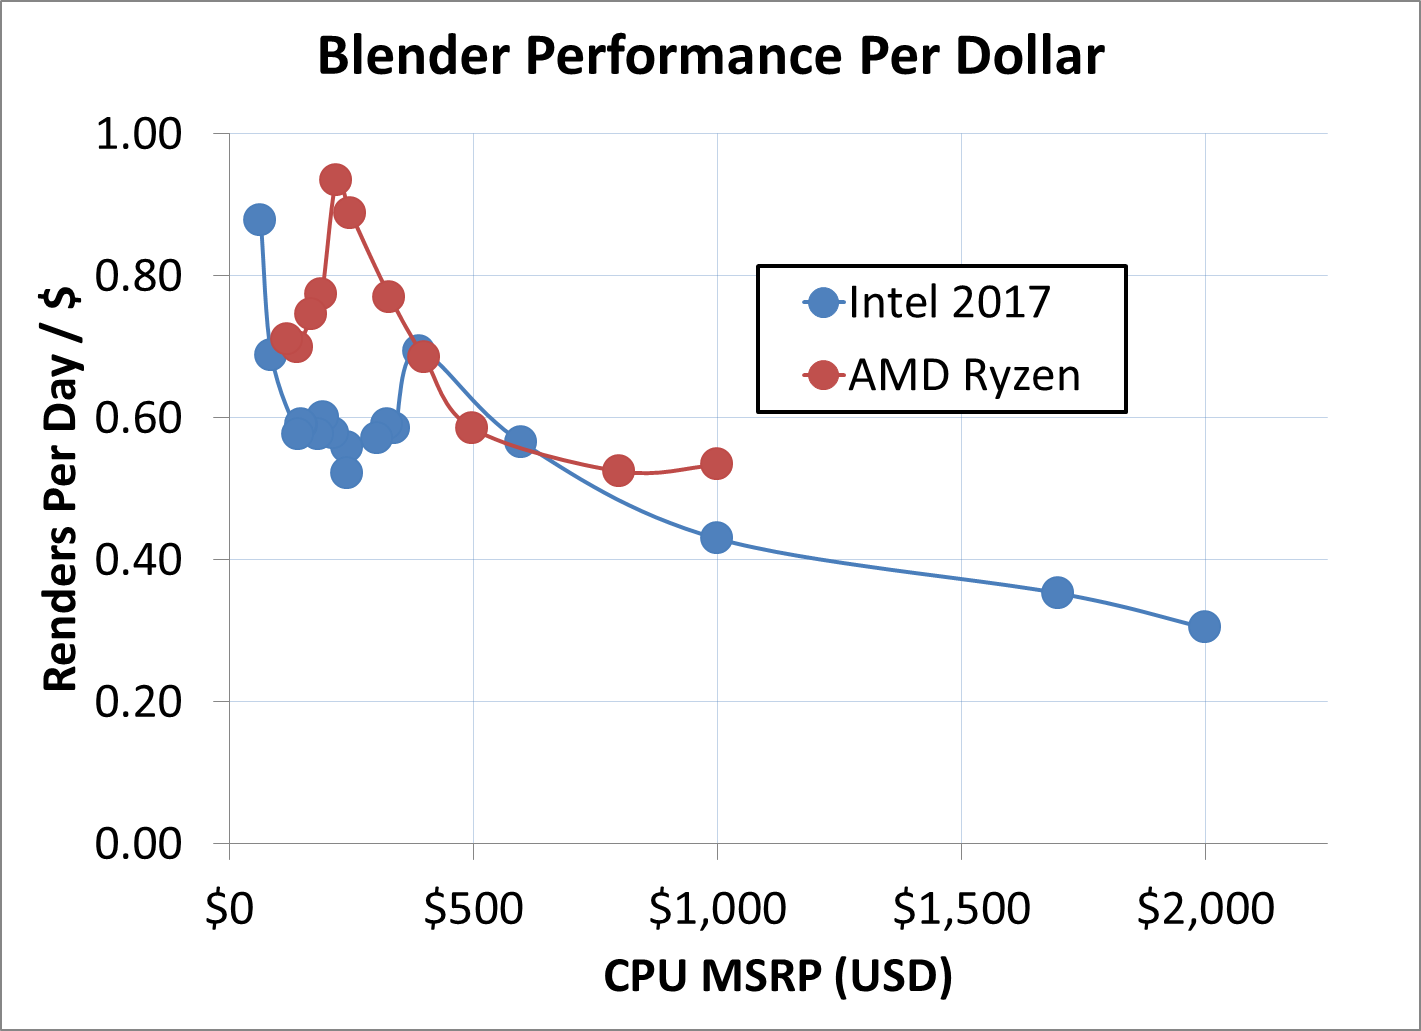
Interestingly AMD takes the peak PPD across the full range. At $999, where the competition is expected to be highest, AMD has over a 10% advantage. In the four digit range, even though the PPD of Intel's processors is lower, the absolute performance is still better. For our Blender test, this translates so a few seconds over a 2-3 minute test.
Cinebench R15 nT Performance Per Dollar
Next we move into the pure multithreaded benchmarks, which can be a significant number of workstation workloads. Here Intel might be at a disadvantage, with AMD offering more cores and more threads at each price point - Intel's IPC advantage will have to offset this in order to move ahead.
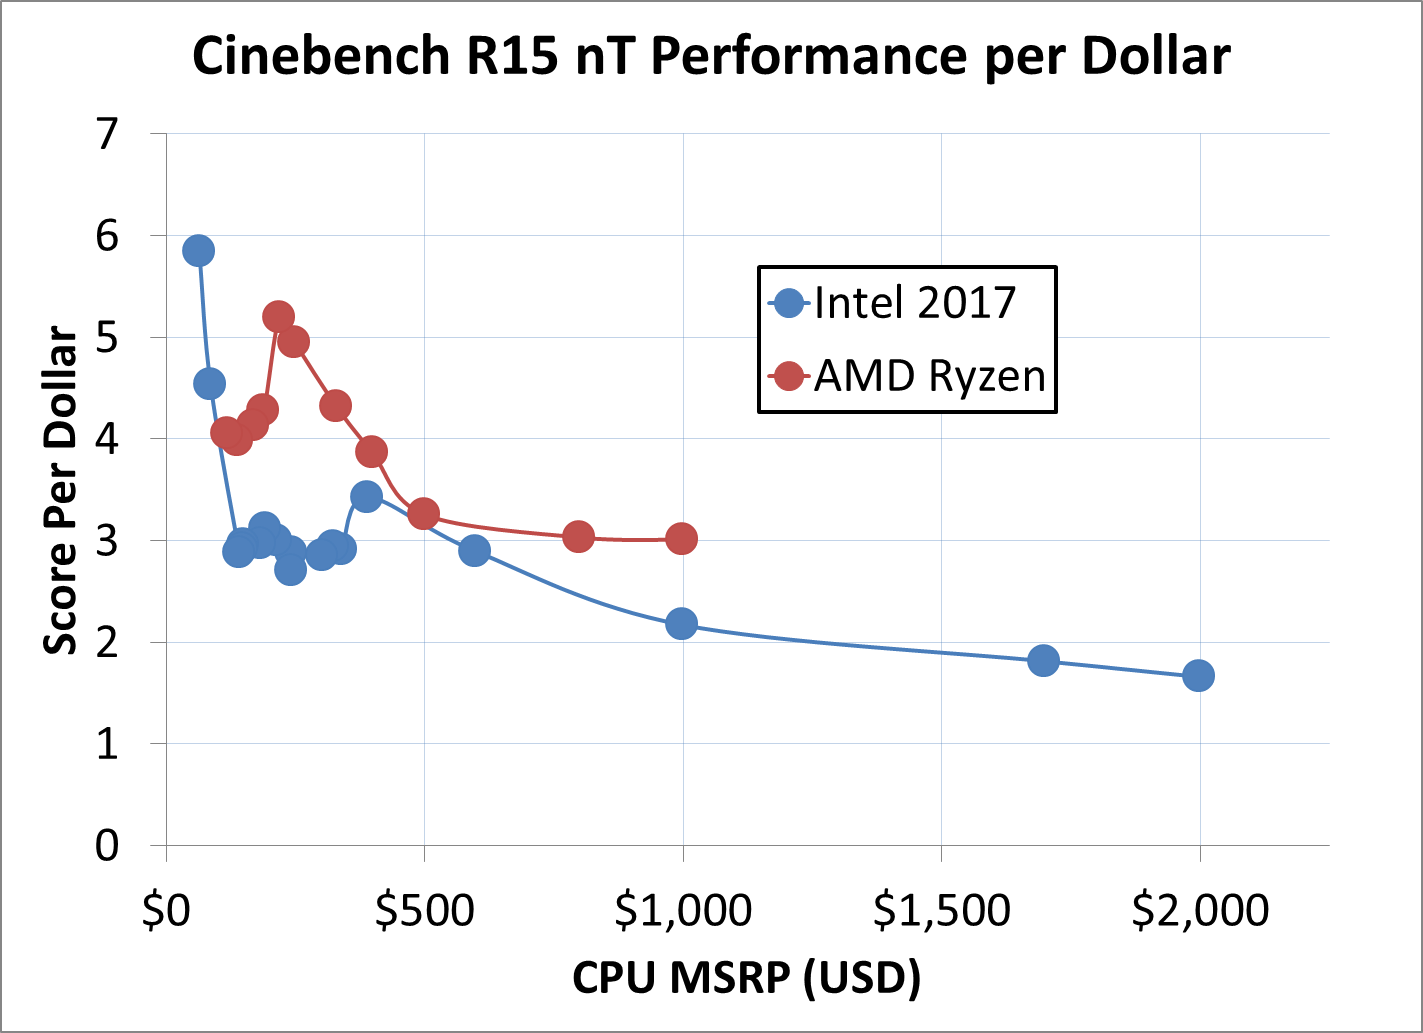
To lay some background here: AMD has been plugging Cinebench R15 nT benchmark numbers since the launch of Zen, citing better PPD. Intel's rebuttal is that in absolute performance, when you need the absolute best results, their hardware still wins.
Corona Rendering Performance Per Dollar
Ray tracing is another example of light threads taking advantage of more cores, more frequency, higher IPC and accelerated intructions with fast FP throughput. Citing back to Johan's EPYC review again, which showed AMD's good base FP performance, it will be an interesting comparison.
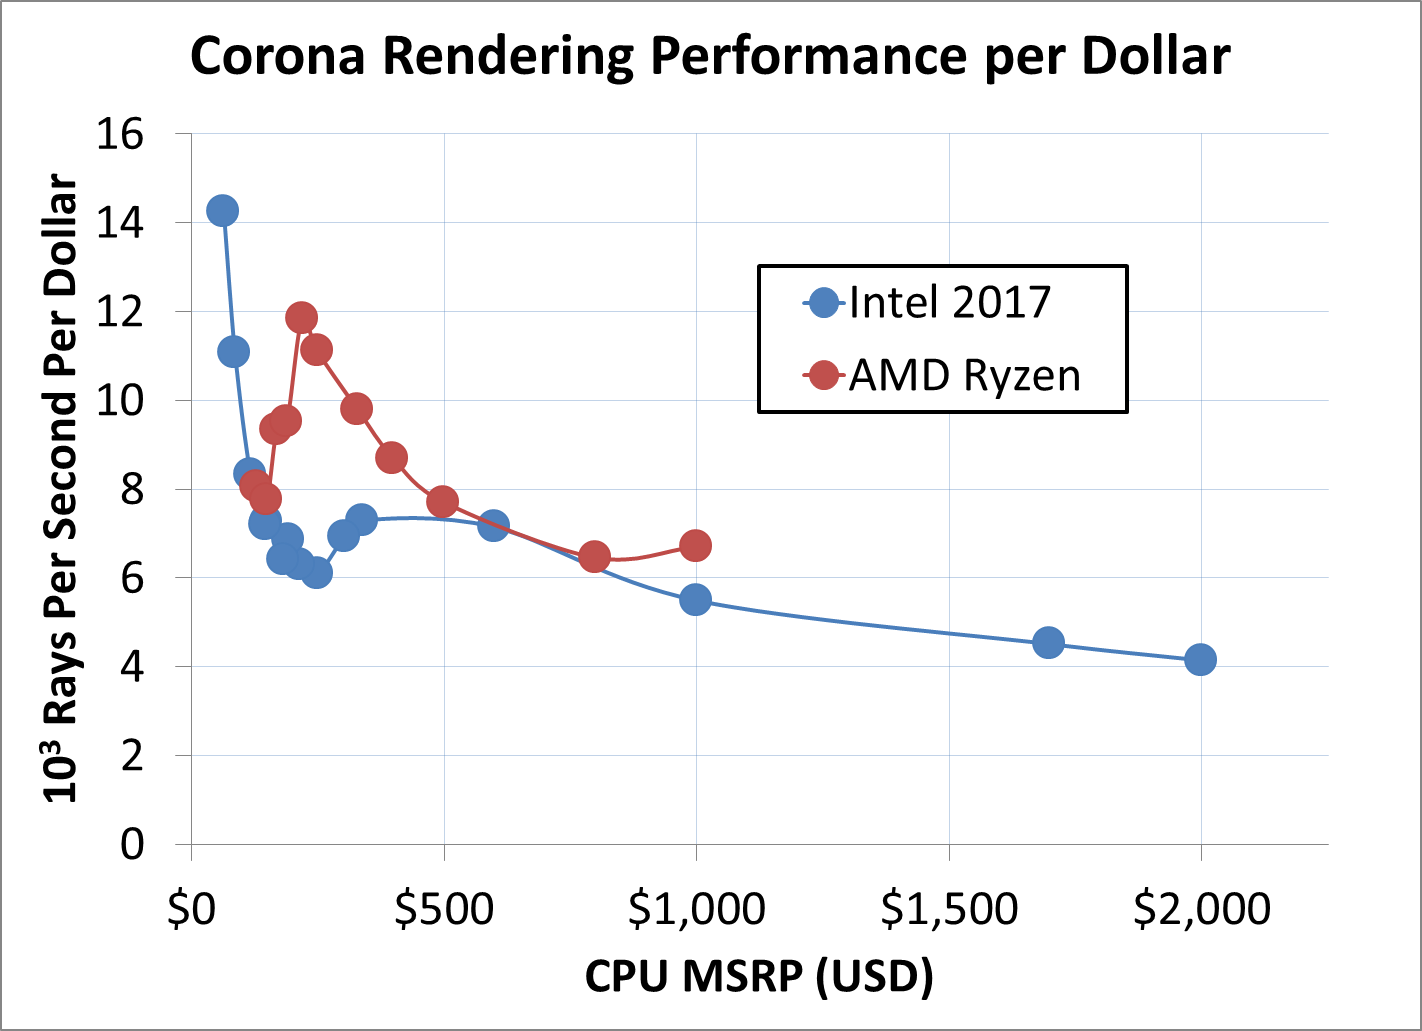
Similar to some of the previous graphs, the best PPD is held at Intel's low end Pentium processors - however these do not give the best overall throughput. In the mainstream price range, the Ryzen 5 1600 and 1600X are suprising peak results. In the $500-$800 range, Intel and AMD are about equal, however at $999 the Threadripper is ahead of the Core i9. Again, at the $1500+ range, Intel offers the better overall throughput, despite the lower PPD.


152 Comments
View All Comments
IGTrading - Tuesday, September 26, 2017 - link
Thanks man , after 21 years in IT hardware I don't know ;)Have a fun life and enjoy your "wisdom" :)
whatevs - Tuesday, September 26, 2017 - link
Seeing these new cpus released, sold and used I think Intel has a better idea of what it is doing than you.Good luck competing with Intel in your "experience in the industry" category.
0ldman79 - Wednesday, September 27, 2017 - link
I'm sure he'll be fine.He was here before the "165W" chip and I'm sure he'll be here long after it is gone, same as me.
ZeDestructor - Monday, September 25, 2017 - link
Laptops and tablets break TDP all the time under Turbo loads. I don't see anyone bitching there...0ldman79 - Wednesday, September 27, 2017 - link
It's really no different than if a car was sold with inadequate cooling."Average" heat production at normal speeds is fine, but if you actually come close to using the 300HP the engine produces by, I dunno, pulling a trailer at those same speeds it will overheat and you'll have to pull over and let it cool.
But sure, it's Intel, so it's cool...
HStewart - Monday, September 25, 2017 - link
I have a still running dual Intel Xeon 3Gz 5160 and my biggest complaint is that the box is huge. This machine is 10 years old has 8G of memory and about 5T of storage. It CPU's alone cost around $2000 and in your terms it like the Bentley or my 2000 Toyota Tundra with Lexus Engine with 240,000. In essence you get what you pay for.wolfemane - Tuesday, September 26, 2017 - link
Hate to break it to ya but that Lexus motor IS a Toyota motor. And by going Lexus you way overpaid for a Toyota.Garf75 - Monday, September 25, 2017 - link
Ian, why are there no temperatures posted?extide - Monday, September 25, 2017 - link
Probably because they are highly dependant on the cooler used and the environment it is in. Not really relevant to an article like this.Garf75 - Monday, September 25, 2017 - link
Seriously? As a customer I would want to know if my cooling system is adequate for the job if I'm pushing the CPU.