The Intel Core i9-7980XE and Core i9-7960X CPU Review Part 1: Workstation
by Ian Cutress on September 25, 2017 3:01 AM ESTBenchmarking Performance: CPU Legacy Tests
Our legacy tests represent benchmarks that were once at the height of their time. Some of these are industry standard synthetics, and we have data going back over 10 years. All of the data here has been rerun on Windows 10, and we plan to go back several generations of components to see how performance has evolved.
All of our benchmark results can also be found in our benchmark engine, Bench.
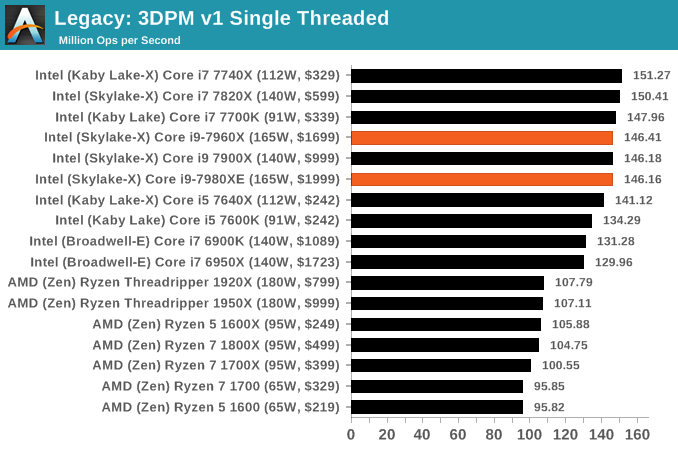
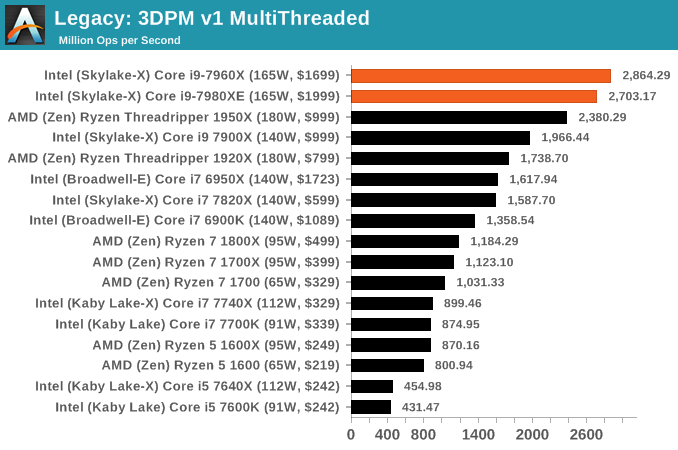
3D Particle Movement v1
3DPM is a self-penned benchmark, taking basic 3D movement algorithms used in Brownian Motion simulations and testing them for speed. High floating point performance, MHz and IPC wins in the single thread version, whereas the multithread version has to handle the threads and loves more cores. This is the original version, written in the style of a typical non-computer science student coding up an algorithm for their theoretical problem, and comes without any non-obvious optimizations not already performed by the compiler, such as false sharing.
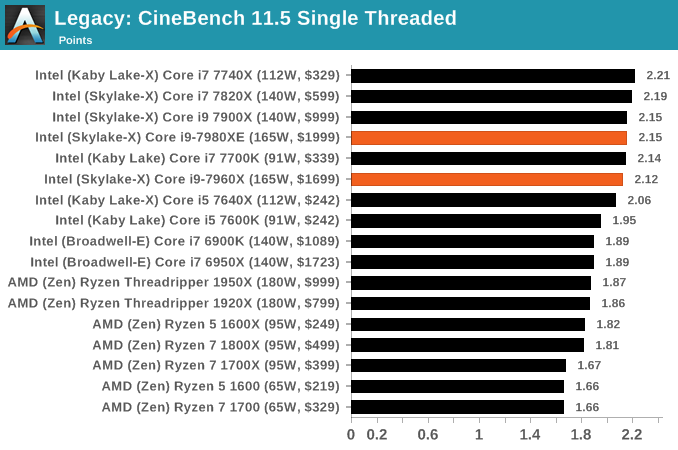
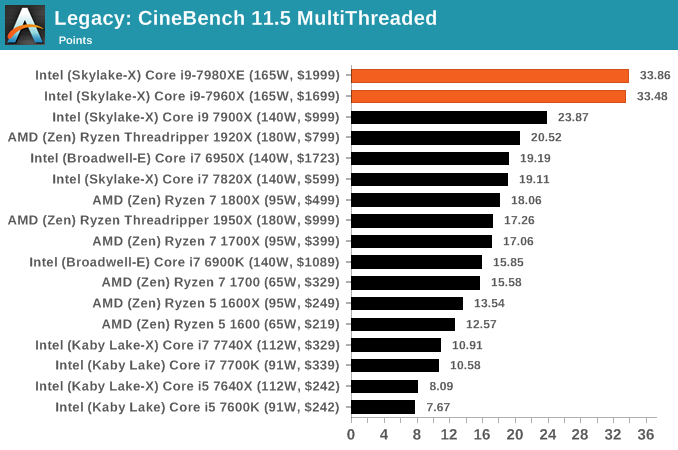
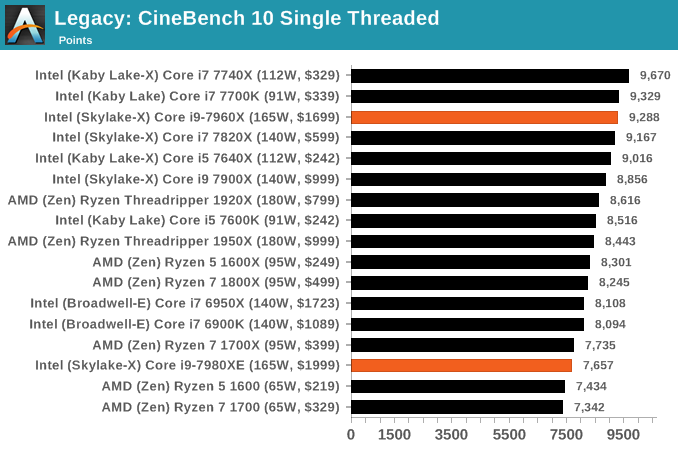
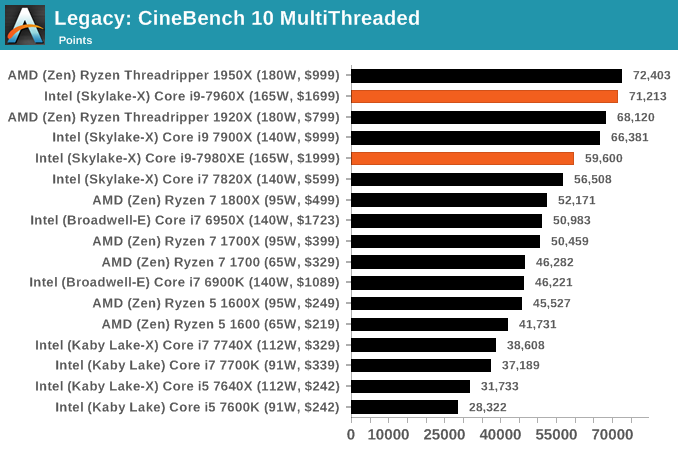
CineBench 11.5 and 10
Cinebench is a widely known benchmarking tool for measuring performance relative to MAXON's animation software Cinema 4D. Cinebench has been optimized over a decade and focuses on purely CPU horsepower, meaning if there is a discrepancy in pure throughput characteristics, Cinebench is likely to show that discrepancy. Arguably other software doesn't make use of all the tools available, so the real world relevance might purely be academic, but given our large database of data for Cinebench it seems difficult to ignore a small five minute test. We run the modern version 15 in this test, as well as the older 11.5 and 10 due to our back data.
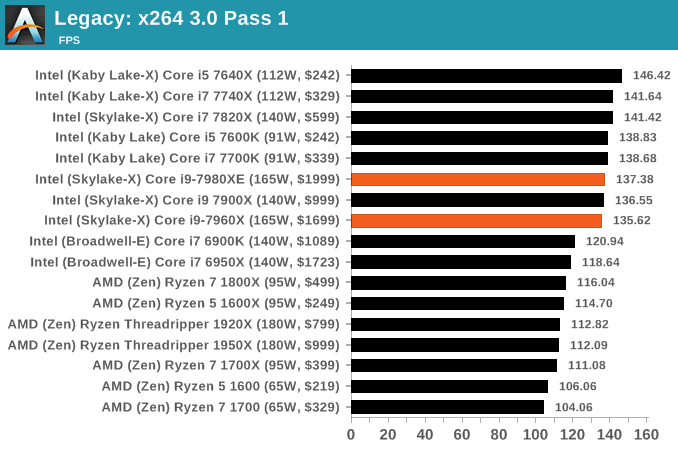
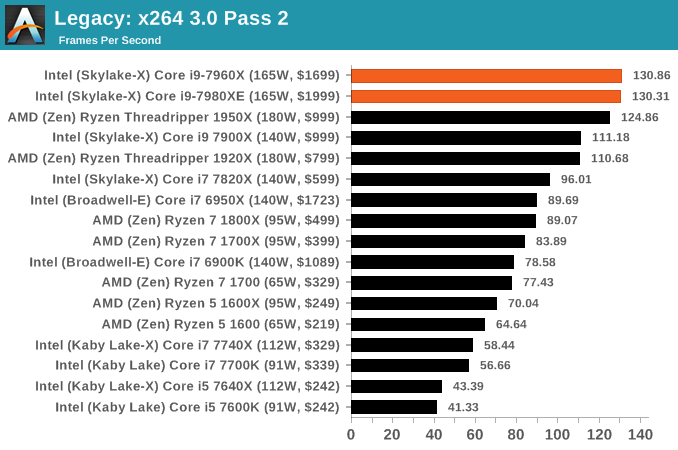
x264 HD 3.0
Similarly, the x264 HD 3.0 package we use here is also kept for historic regressional data. The latest version is 5.0.1, and encodes a 1080p video clip into a high quality x264 file. Version 3.0 only performs the same test on a 720p file, and in most circumstances the software performance hits its limit on high end processors, but still works well for mainstream and low-end. Also, this version only takes a few minutes, whereas the latest can take over 90 minutes to run.


152 Comments
View All Comments
mapesdhs - Monday, September 25, 2017 - link
Ian, thanks for the great review! Very much appreciate the initial focus on productivity tasks, encoding, rendering, etc., instead of games. One thing though, something that's almost always missing from reviews like this (ditto here), how do these CPUs behave for platform stability with max RAM, especially when oc'd?When I started building oc'd X79 systems for prosumers on a budget, they often wanted the max 64GB. This turned out to be more complicated than I'd expected, as reviews and certainly most oc forum "clubs" achieved their wonderful results with only modest amounts of RAM, in the case of X79 typically 16GB. Mbd vendors told me published expectations were never with max RAM in mind, and it was "normal" for a mbd to launch without stable BIOS support for a max RAM config at all (blimey). With 64GB installed (I used two GSkill TridentX/2400 4x8GB kits), it was much harder to achieve what was normally considered a typical oc for a 3930K (mab was the ASUS P9X79 WS, basically an R4E but with PLEX chips and some pro features), especially if one wanted the RAM running at 2133 or 2400. Talking to ASUS, they were very helpful and advised on some BIOS tweaks not mentioned in their usual oc guides to specifically help in cases where all RAM slots were occupied and the density was high, especially a max RAM config. Eventually I was able to get 4.8GHz with 64GB @ 2133. However, with the help of an AE expert (this relates to the lack of ECC I reckon), I was also able to determine that although the system could pass every benchmark I could throw at it (all of toms' CPU tests for that era, all 3DMark, CB, etc.), a large AE render (gobbles 40GB RAM) would result in pixel artefacts in the final render which someone like myself (not an AE user) would never notice, but the AE guy spotted them instantly. This was very interesting to me and not something I've ever seen mentioned in any article, ie. an oc'd consumer PC can be "stable" (benchmarks, Prime95 and all the rest of it), but not correct, ie. the memory is sending back incorrect data, but not in a manner that causes a crash. Dropping the clock to 4.7 resolved the issue. Tests like P95 and 3DMark only test parts of a system; a large AE render hammered the whole lot (storage, CPU, RAM and three GTX 580s).
Thus, could you or will you be able at some point to test how these CPUs/mbds behave with the max 128GB fitted? I suspect you'd find it a very different experience compared to just having 32GB installed, especially under oc'd conditions. It stresses the IMCs so much more.
I note the Gigabyte specs page says the mbd supports up to 512GB with Registered DIMMs; any chance a memory corp could help you test that? Mind you, I suspect that without ECC, the kind of user who would want that much RAM would probably not be interested in such a system anyway (XEON or EPYC much more sensible).
Ian.
peevee - Monday, September 25, 2017 - link
"256 KB per core to 1 MB per core. To compensate for the increase in die area, Intel reduced the size of the size of the L3 from 2.5 MB per core to 1.375 MB per core, keeping the overall L2+L3 constant"You might want to check your calculator.
tygrus - Monday, September 25, 2017 - link
Maybe Intel saw the AMD TR numbers and had to add 10-15% to their expected freqs. Sure, there is some power that goes to the CPU which ends up in RAM et. al. but these are expensive room heaters. Intel marketing bunnies thought 165w looked better thn 180w to fool the customers.eddieobscurant - Monday, September 25, 2017 - link
Wow! Another intel pro review. I was expecting this but having graphs displaying intels perf/$ advantage, just wow , you've really outdone yourselves this time.Of course i wanted to see how long are you gonna keep delaying the gaming benchmarks of intel's core i9 due to mess rearrangement horrid performance. I guess you're expecting game developers to fix what can be fixed. It's been already several months, but on ryzen you were displaying a few issues since day 1.
You tested amd with 2400mhz ram , when you know that performance is affected with anything below 3200mhz.
Several different intel cpus come and go into your graphs only to show that a different intel cpu is better when core i9 lacks in performance and an amd cpu is better.
Didn't even mention the negligent performance difference bettween the 7960x and 7980xe. Just take a look at phoronix review.
Can this site even get any lower? Anands name is the only thing keeping it afloat.
mkaibear - Tuesday, September 26, 2017 - link
Erm, there are five graphs on the performance/$ page, and three of them show AMD with a clear price/$ advantage in everything except the very top end and the very bottom end (and one of the other two is pretty much a tie)....how can you possibly call that a pro-Intel review?
wolfemane - Tuesday, September 26, 2017 - link
And why the heck would you want game reviews on these CPUs anyways? By now we KNOW what the results are gonna be and they won't be astonishing. And more than likely will be under a 7700k. Game benchmarks are utterly worthless for these CPUs and any kind of s surprise by the reader in their lack of overall performance in game is the readers fault for not paying attention to previous reviews.Notmyusualid - Tuesday, September 26, 2017 - link
Sorry to distract gents (and ladies?), and even though I am not a fan of liquid nitrogen, here:http://www.pcgamer.com/overclocked-core-i9-7980xe-...
gagegfg - Tuesday, September 26, 2017 - link
EPYC 7551P vs core i9 790XEThat is the true comparison, or not?
$2000 vs $2000
gagegfg - Tuesday, September 26, 2017 - link
EPYC 7551P vs core i9 7980XEThat is the true comparison, or not?
$2000 vs $2000
IGTrading - Tuesday, September 26, 2017 - link
That's a perfectly valid comparison with the exception of the fact that Intel's X299 platform will look completely handicapped next to AMD's EPYC based solution and it will have just half of the computational power.