The Intel Core i9-7980XE and Core i9-7960X CPU Review Part 1: Workstation
by Ian Cutress on September 25, 2017 3:01 AM ESTBenchmarking Performance: CPU Rendering Tests
Rendering tests are a long-time favorite of reviewers and benchmarkers, as the code used by rendering packages is usually highly optimized to squeeze every little bit of performance out. Sometimes rendering programs end up being heavily memory dependent as well - when you have that many threads flying about with a ton of data, having low latency memory can be key to everything. Here we take a few of the usual rendering packages under Windows 10, as well as a few new interesting benchmarks.
All of our benchmark results can also be found in our benchmark engine, Bench.
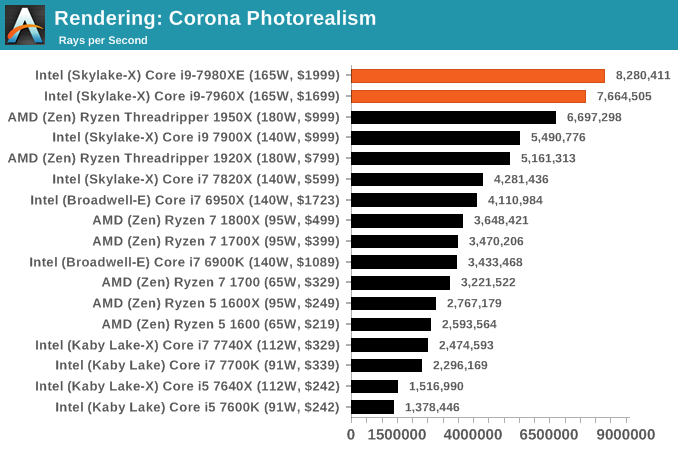
Corona 1.3: link
Corona is a standalone package designed to assist software like 3ds Max and Maya with photorealism via ray tracing. It's simple - shoot rays, get pixels. OK, it's more complicated than that, but the benchmark renders a fixed scene six times and offers results in terms of time and rays per second. The official benchmark tables list user submitted results in terms of time, however I feel rays per second is a better metric (in general, scores where higher is better seem to be easier to explain anyway). Corona likes to pile on the threads, so the results end up being very staggered based on thread count.
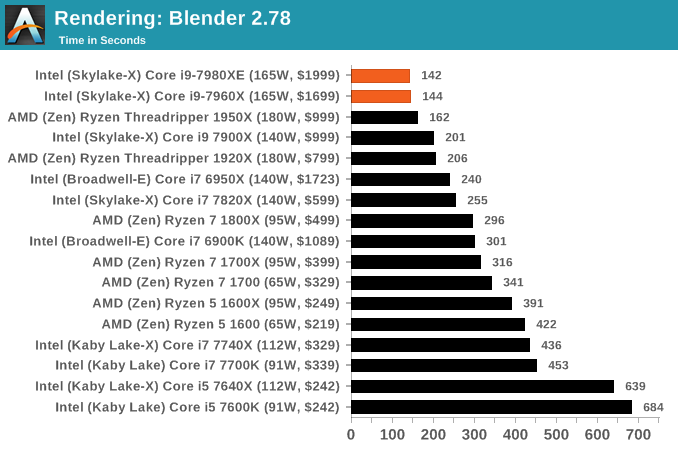
Blender 2.78: link
For a render that has been around for what seems like ages, Blender is still a highly popular tool. We managed to wrap up a standard workload into the February 5 nightly build of Blender and measure the time it takes to render the first frame of the scene. Being one of the bigger open source tools out there, it means both AMD and Intel work actively to help improve the codebase, for better or for worse on their own/each other's microarchitecture.
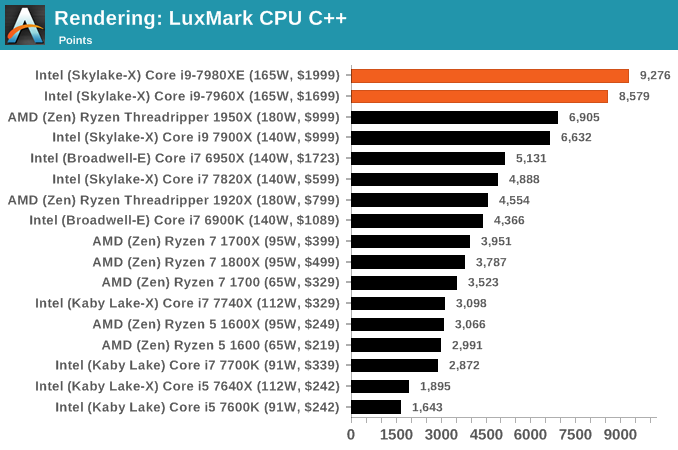
LuxMark v3.1: Link
As a synthetic, LuxMark might come across as somewhat arbitrary as a renderer, given that it's mainly used to test GPUs, but it does offer both an OpenCL and a standard C++ mode. In this instance, aside from seeing the comparison in each coding mode for cores and IPC, we also get to see the difference in performance moving from a C++ based code-stack to an OpenCL one with a CPU as the main host.
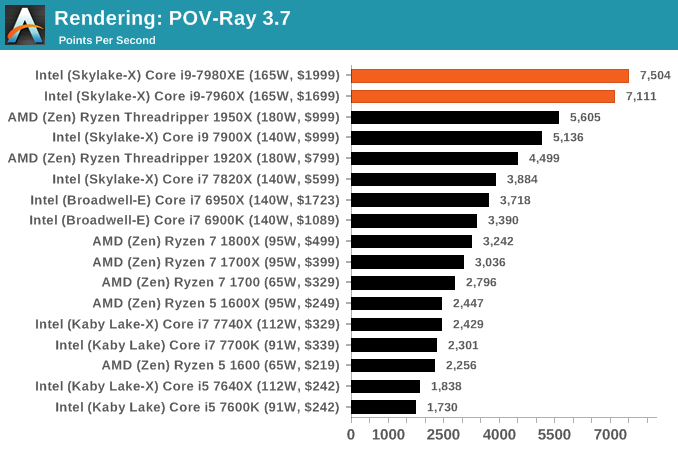
POV-Ray 3.7.1b4: link
Another regular benchmark in most suites, POV-Ray is another ray-tracer but has been around for many years. It just so happens that during the run up to AMD's Ryzen launch, the code base started to get active again with developers making changes to the code and pushing out updates. Our version and benchmarking started just before that was happening, but given time we will see where the POV-Ray code ends up and adjust in due course.
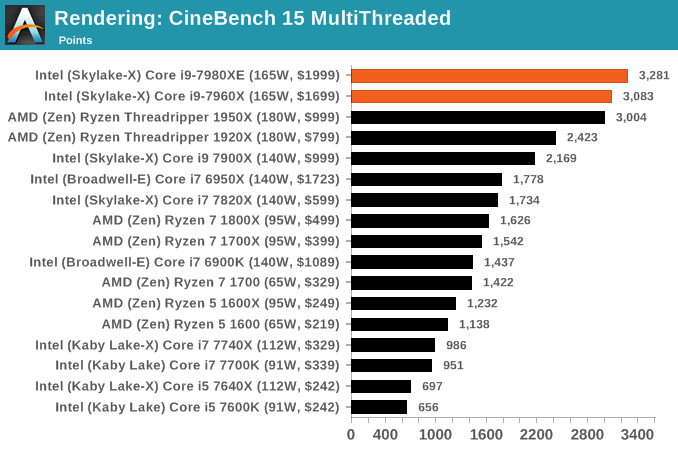
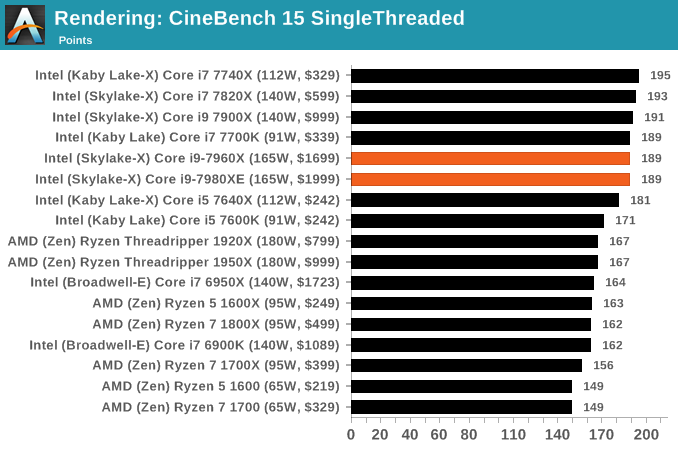
Cinebench R15: link
The latest version of CineBench has also become one of those 'used everywhere' benchmarks, particularly as an indicator of single thread performance. High IPC and high frequency gives performance in ST, whereas having good scaling and many cores is where the MT test wins out.


152 Comments
View All Comments
mapesdhs - Monday, September 25, 2017 - link
Ian, thanks for the great review! Very much appreciate the initial focus on productivity tasks, encoding, rendering, etc., instead of games. One thing though, something that's almost always missing from reviews like this (ditto here), how do these CPUs behave for platform stability with max RAM, especially when oc'd?When I started building oc'd X79 systems for prosumers on a budget, they often wanted the max 64GB. This turned out to be more complicated than I'd expected, as reviews and certainly most oc forum "clubs" achieved their wonderful results with only modest amounts of RAM, in the case of X79 typically 16GB. Mbd vendors told me published expectations were never with max RAM in mind, and it was "normal" for a mbd to launch without stable BIOS support for a max RAM config at all (blimey). With 64GB installed (I used two GSkill TridentX/2400 4x8GB kits), it was much harder to achieve what was normally considered a typical oc for a 3930K (mab was the ASUS P9X79 WS, basically an R4E but with PLEX chips and some pro features), especially if one wanted the RAM running at 2133 or 2400. Talking to ASUS, they were very helpful and advised on some BIOS tweaks not mentioned in their usual oc guides to specifically help in cases where all RAM slots were occupied and the density was high, especially a max RAM config. Eventually I was able to get 4.8GHz with 64GB @ 2133. However, with the help of an AE expert (this relates to the lack of ECC I reckon), I was also able to determine that although the system could pass every benchmark I could throw at it (all of toms' CPU tests for that era, all 3DMark, CB, etc.), a large AE render (gobbles 40GB RAM) would result in pixel artefacts in the final render which someone like myself (not an AE user) would never notice, but the AE guy spotted them instantly. This was very interesting to me and not something I've ever seen mentioned in any article, ie. an oc'd consumer PC can be "stable" (benchmarks, Prime95 and all the rest of it), but not correct, ie. the memory is sending back incorrect data, but not in a manner that causes a crash. Dropping the clock to 4.7 resolved the issue. Tests like P95 and 3DMark only test parts of a system; a large AE render hammered the whole lot (storage, CPU, RAM and three GTX 580s).
Thus, could you or will you be able at some point to test how these CPUs/mbds behave with the max 128GB fitted? I suspect you'd find it a very different experience compared to just having 32GB installed, especially under oc'd conditions. It stresses the IMCs so much more.
I note the Gigabyte specs page says the mbd supports up to 512GB with Registered DIMMs; any chance a memory corp could help you test that? Mind you, I suspect that without ECC, the kind of user who would want that much RAM would probably not be interested in such a system anyway (XEON or EPYC much more sensible).
Ian.
peevee - Monday, September 25, 2017 - link
"256 KB per core to 1 MB per core. To compensate for the increase in die area, Intel reduced the size of the size of the L3 from 2.5 MB per core to 1.375 MB per core, keeping the overall L2+L3 constant"You might want to check your calculator.
tygrus - Monday, September 25, 2017 - link
Maybe Intel saw the AMD TR numbers and had to add 10-15% to their expected freqs. Sure, there is some power that goes to the CPU which ends up in RAM et. al. but these are expensive room heaters. Intel marketing bunnies thought 165w looked better thn 180w to fool the customers.eddieobscurant - Monday, September 25, 2017 - link
Wow! Another intel pro review. I was expecting this but having graphs displaying intels perf/$ advantage, just wow , you've really outdone yourselves this time.Of course i wanted to see how long are you gonna keep delaying the gaming benchmarks of intel's core i9 due to mess rearrangement horrid performance. I guess you're expecting game developers to fix what can be fixed. It's been already several months, but on ryzen you were displaying a few issues since day 1.
You tested amd with 2400mhz ram , when you know that performance is affected with anything below 3200mhz.
Several different intel cpus come and go into your graphs only to show that a different intel cpu is better when core i9 lacks in performance and an amd cpu is better.
Didn't even mention the negligent performance difference bettween the 7960x and 7980xe. Just take a look at phoronix review.
Can this site even get any lower? Anands name is the only thing keeping it afloat.
mkaibear - Tuesday, September 26, 2017 - link
Erm, there are five graphs on the performance/$ page, and three of them show AMD with a clear price/$ advantage in everything except the very top end and the very bottom end (and one of the other two is pretty much a tie)....how can you possibly call that a pro-Intel review?
wolfemane - Tuesday, September 26, 2017 - link
And why the heck would you want game reviews on these CPUs anyways? By now we KNOW what the results are gonna be and they won't be astonishing. And more than likely will be under a 7700k. Game benchmarks are utterly worthless for these CPUs and any kind of s surprise by the reader in their lack of overall performance in game is the readers fault for not paying attention to previous reviews.Notmyusualid - Tuesday, September 26, 2017 - link
Sorry to distract gents (and ladies?), and even though I am not a fan of liquid nitrogen, here:http://www.pcgamer.com/overclocked-core-i9-7980xe-...
gagegfg - Tuesday, September 26, 2017 - link
EPYC 7551P vs core i9 790XEThat is the true comparison, or not?
$2000 vs $2000
gagegfg - Tuesday, September 26, 2017 - link
EPYC 7551P vs core i9 7980XEThat is the true comparison, or not?
$2000 vs $2000
IGTrading - Tuesday, September 26, 2017 - link
That's a perfectly valid comparison with the exception of the fact that Intel's X299 platform will look completely handicapped next to AMD's EPYC based solution and it will have just half of the computational power.